
Overview: Zonka Feedback and Spark Chart as Customer Feedback Management Category solutions.
Zonka Feedback excels in offering comprehensive feedback collection and customer satisfaction tracking. It's a strong solution for industries like healthcare and retail. Spark Chart, on the other hand, focuses on empowering large enterprises with market research and social media analytics. Companies in management consulting and marketing will find its features like training and onboarding highly beneficial. Both platforms have clear strengths, with Zonka Feedback prioritizing customer satisfaction tools and Spark Chart enhancing brand awareness and process efficiency.
Zonka Feedback: Zonka Feedback is an omnichannel Customer Feedback Software to measure real-time CX Metrics like NPS, CES, and CSAT. Surveys are conducted via the Zonka Feedback app.
Spark Chart: Spark Chart offers professional survey software features to manage projects and generate detailed reports. Users can quickly become experts with its intuitive tools.
Zonka Feedback and Spark Chart: Best Use cases based on the customer satisfaction data


Key Capabilities Supported
Zonka Feedback supports collecting feedback, measuring customer satisfaction, and managing communication for direct customer insights. read more →
Spark Chart focuses on market research, feedback collection, and following up, enabling detailed market and social analysis. read more →
Business Goals
Zonka Feedback aims to improve customer satisfaction and digital presence, leveraging its analytics to enhance business interactions. read more →
Spark Chart assists in building brand awareness and improving efficiency, reflecting its alignment with enterprise strategic goals. read more →
Core Features
Zonka Feedback provides robust analytics and custom reports, with integrations ensuring seamless data-driven decisions. read more →
Spark Chart offers training and onboarding, along with strong analytics and compliance features, ensuring comprehensive user preparation and security. read more →
Vendor Support
Zonka Feedback includes 24/7 email and phone support, demonstrating its commitment to constant customer assistance. read more →
Spark Chart offers personalized training and onboarding, plus 24/7 support options, focusing on user empowerment. read more →
Segments and Industries
Zonka Feedback is popular among healthcare and retail, catering to enterprises seeking detailed feedback management. read more →
Spark Chart is favored by large enterprises and management consulting, proving suitable for broad industry requirements. read more →
Operational Alignment
Zonka Feedback's platform integrates well into service-oriented workflows, adapting to various operational scales. read more →
Spark Chart adapts to large enterprises with complex structures, supporting precise data and social interactions efficiently. read more →

Applying your context and needs changes the comparison
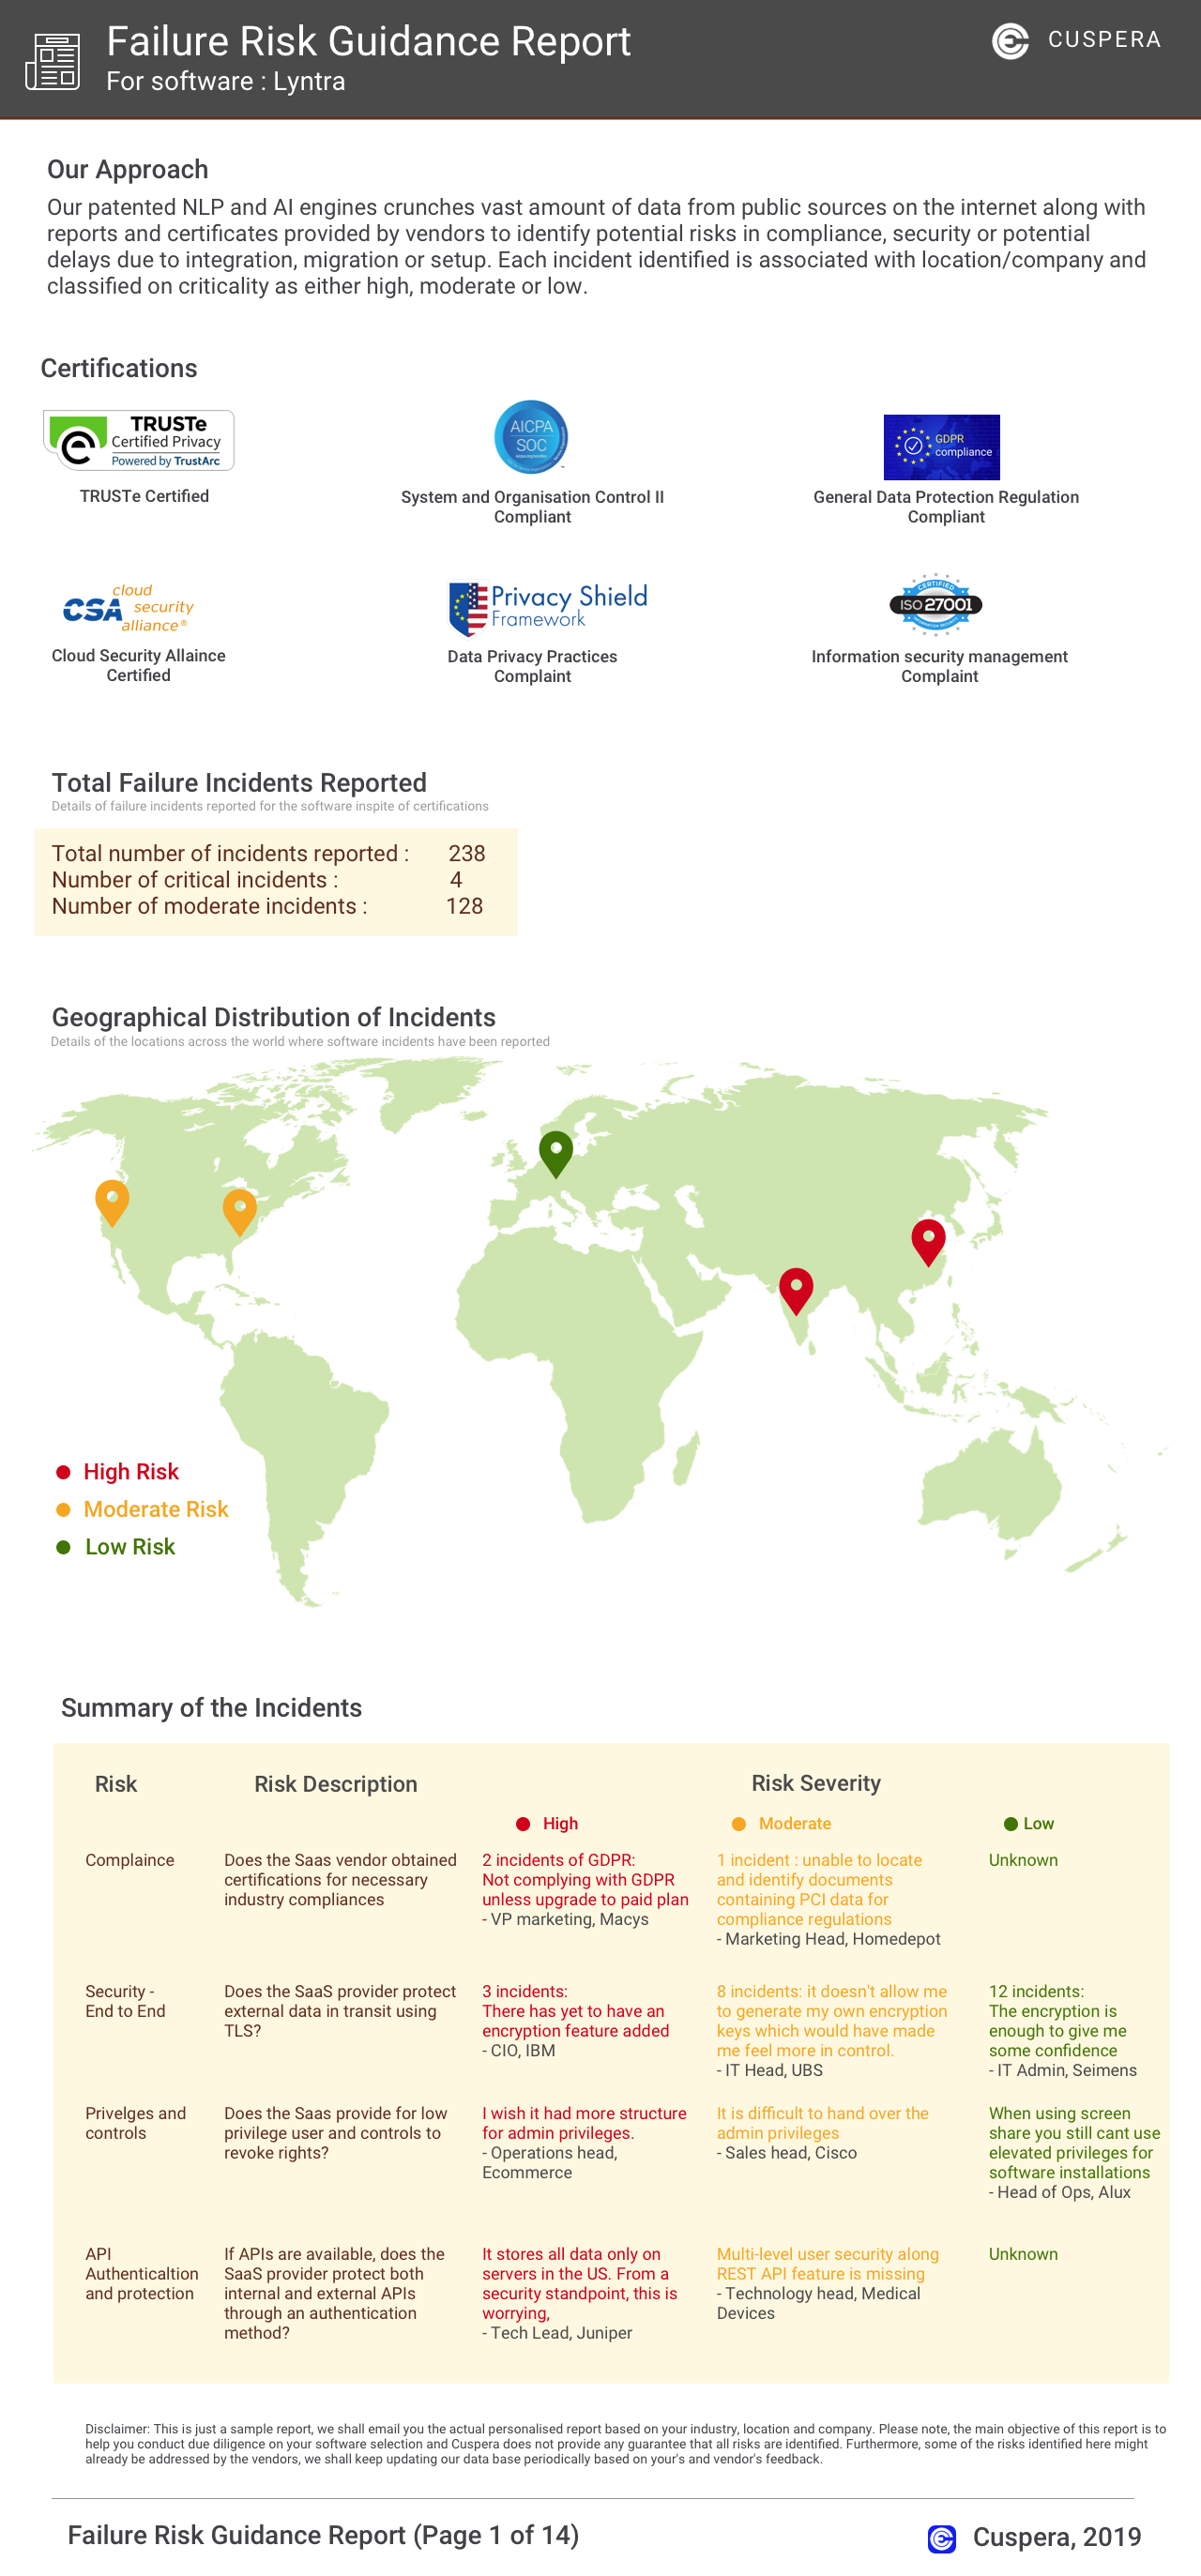
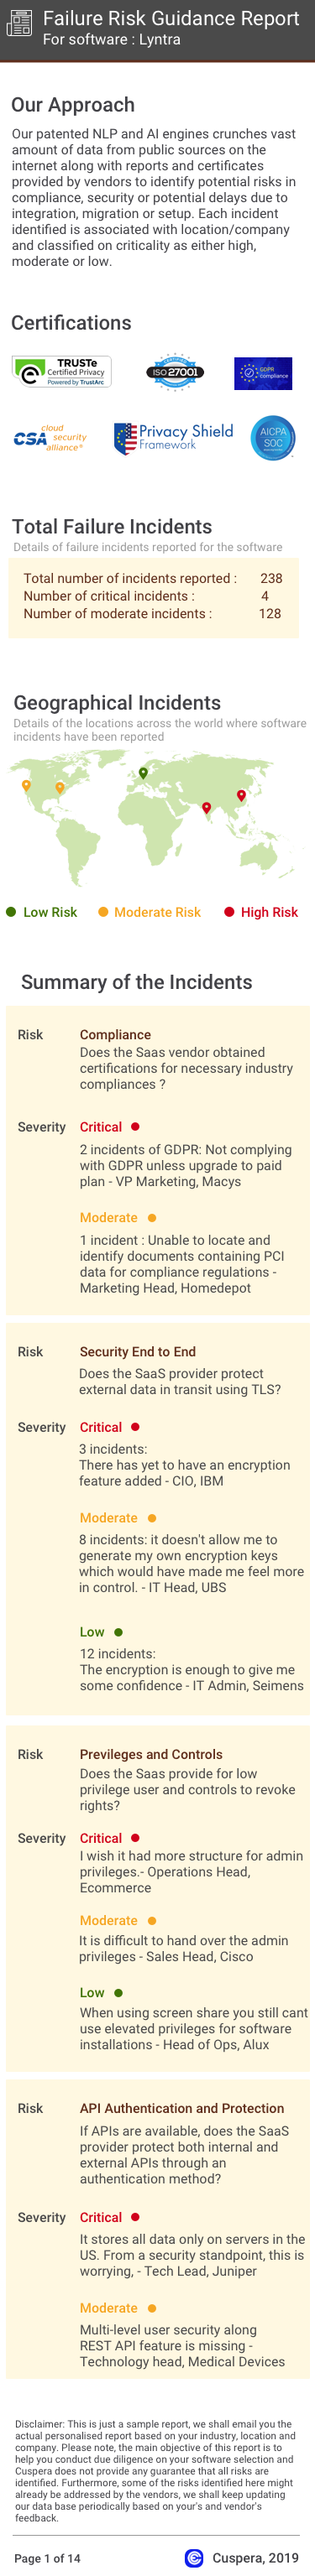
Failure Risk Guidance?
Compliance Risk
{{{rsh_C_1}}}
{{{rsh_C_1}}}
Security & Privacy Risk
{{{rsh_C_1}}}
{{{rsh_C_1}}}
Integration Risk
{{{rsh_C_1}}}
{{{rsh_C_1}}}
Migration Risk
{{{rsh_C_1}}}
{{{rsh_C_1}}}
IT and Other Capabilities
- Low
- Medium
- High


How does Spark Chart address your Social Media Management Challenges?