
Comparison Summary
This comparison report of Piktochart vs. Sprinklr Social is based on a specific set of business needs and context. The comparison uses 7172 Cuspera insights based on peer reviews, case studies, testimonials, and expert opinions across 50+ sources.
Introducing Piktochart and Sprinklr Social
Piktochart, Visme, Powtoon, etc., belong to a category of solutions that help Presentation Software, whereas Sprinklr Social, Meltwater Social Media Analytics, Statusbrew, etc., belong to a category of solutions that help Social Media Marketing. Different products excel in different areas, so the best platform for your business will depend on your specific needs and requirements.
Piktochart covers Engagement Management with Social Media, Social Media Management with Social Media, Content Management with Social Media, Communication Management with Social Media, etc.
Sprinklr Social focuses on Social Media Management with Social Media, Communication Management with Social Media, Engagement Management with Social Media, Content Management with Social Media, etc.
"When you think about software that’s free and online that allows you to create infographics, there’s not a lot. I mean, now there’s a couple of sites but back then, it was really just Google Slides, which you can’t make a good-looking infographic on... a Google slide. You can’t. The format doesn’t work. " - Jamie Barkin
"Everything comes together with the Salesforce integration. The rule engine, tagging, and macros become so much more powerful when you integrate offline events from a CRM. It is a completely different world between what you can do with it versus with...out it. " - Asher Yiftachel
Unsure which of these solutions is right for you? Our Cuspera AI engine can compare them based on your needs and specific to your industry and context. Get your personalized report today.


About
Create Infographics, Presentations, Reports, and Posters.
Delivers a positive experience that’s true to your brand
Age
2011
2009
Financials
SEED
PRIVATE
Business Need
Total Processes
(we found evidences for)
60
64
Total Goals
(we found evidences for)
12
10
Top Processes
Evidences indicate better relative satisfaction
Top Goals
Goals Achieved
-
Build brand awareness
-
Acquire customers
-
Improve internal communications
-
Establish thought leadership
-
Improve digital and social presence
-
Enhance customer relationships
-
Increase sales & revenue
-
Improve ROI
-
Launch new products
-
Scale best practices
-
Grow market share
-
Improve brand engagement
- See 9 more
-
Enhance customer relationships
-
Improve ROI
-
Improve digital and social presence
-
Build brand awareness
-
Improve brand engagement
-
Launch new products
-
Acquire customers
-
Enter new markets internationally or locally
-
Establish thought leadership
-
Improve internal communications
- See 7 more
Top Channels
Channels Used
-
social media
-
website
-
Facebook
-
video
-
Instagram
-
Twitter
-
mobile
-
user generated content
-
blogs
-
e-mail
-
omnichannel
-
Pinterest
-
offline
-
phone calls
-
LinkedIn
-
point of sale
-
on premises
-
mobile app
-
promotions
- See 16 more
-
social media
-
website
-
Facebook
-
video
-
Instagram
-
Twitter
-
mobile
-
user generated content
-
blogs
-
e-mail
-
omnichannel
-
Pinterest
-
offline
-
phone calls
-
LinkedIn
-
point of sale
-
on premises
-
mobile app
-
promotions
- See 16 more
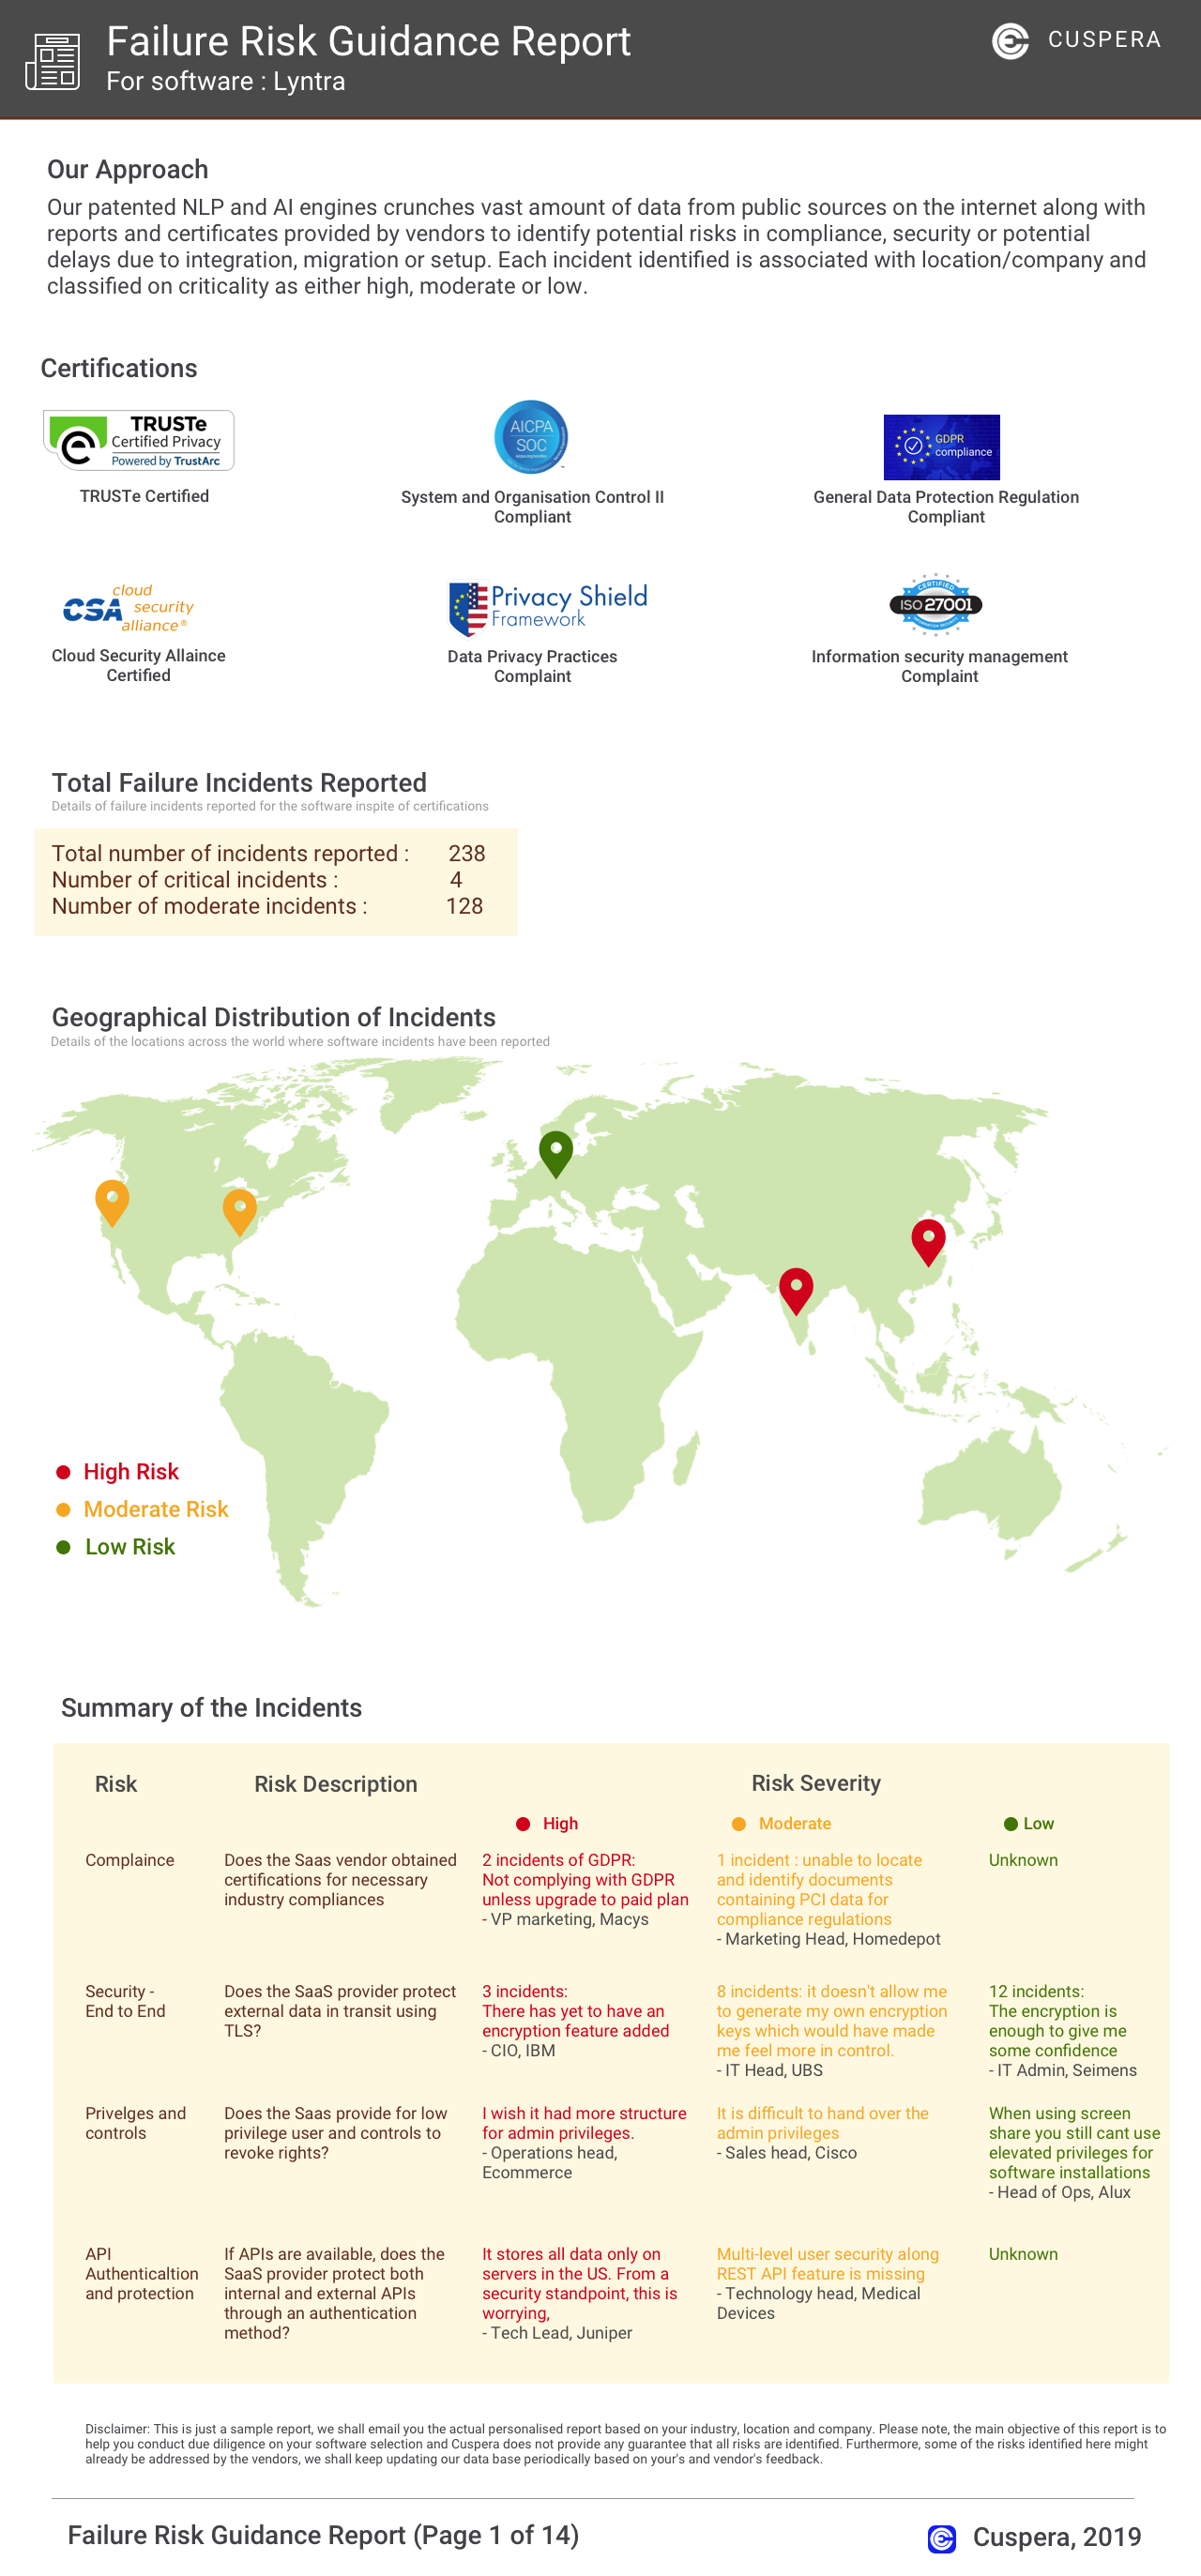
Failure Risk Guidance Security Report?
Compliance Risk
{{{rsh_C_1}}}
{{{rsh_C_1}}}
Security & Privacy Risk
{{{rsh_C_1}}}
{{{rsh_C_1}}}
Integration Risk
{{{rsh_C_1}}}
{{{rsh_C_1}}}
Migration Risk
{{{rsh_C_1}}}
{{{rsh_C_1}}}
IT and Other Capabilities
- Low
- Medium
- High