Comparison Summary
This comparison report of AppsFlyer vs. Adobe Analytics is based on a specific set of business needs and context. The comparison uses 12901 Cuspera insights based on peer reviews, case studies, testimonials, and expert opinions across 50+ sources.
Introducing AppsFlyer and Adobe Analytics
AppsFlyer, Adjust, Kochava, etc., belong to a category of solutions that help Marketing Attribution, whereas Adobe Analytics, Kissmetrics, Google Analytics 360, etc., belong to a category of solutions that help Digital Analytics. Different products excel in different areas, so the best platform for your business will depend on your specific needs and requirements.
AppsFlyer covers Engagement Management, Advertisement with Mobile, Campaign Management with Mobile, Social Media Management with Social Media, etc.
Adobe Analytics focuses on Social Media Management with Website, Engagement Management with Website, Campaign Management with Website, Advertisement, etc.
"AppsFlyer’s real-time attribution and analytics, combined with their deep partner integrations and retargeting capabilities have improved every element of our marketing and communications. " - Fynd
"We have a large volume of students who are exploring programs with us at any time. Adobe Marketo Engage has helped us stay engaged with them over their long decision-making processes. " - Paul Lovegrove
Unsure which of these solutions is right for you? Our Cuspera AI engine can compare them based on your needs and specific to your industry and context. Get your personalized report today.


About
Real-Time, Accurate and Reliable MOBILE DATA AND REPORTS
Industry-leading data with customizable visualizations that drive better marketing decisions
Age
2011
1982
Financials
SERIES D
SERIES A
Business Need
Total Processes
(we found evidences for)
70
97
Total Goals
(we found evidences for)
14
15
Top Processes
Evidences indicate better relative satisfaction
Top Goals
Goals Achieved
-
Improve ROI
-
Increase customer life time value
-
Enhance customer relationships
-
Acquire customers
-
Increase sales & revenue
-
Grow market share
-
Improve efficiency
-
Enter new markets internationally or locally
-
Improve brand engagement
-
Improve digital and social presence
-
Improve stakeholder relations
-
Launch new products
-
Build brand awareness
-
Scale best practices
- See 11 more
-
Acquire customers
-
Enhance customer relationships
-
Improve ROI
-
Increase sales & revenue
-
Improve digital and social presence
-
Improve efficiency
-
Scale best practices
-
Improve brand engagement
-
Enter new markets internationally or locally
-
Grow market share
-
Build brand awareness
-
Increase customer life time value
-
Improve consistency
-
Launch new products
-
Establish thought leadership
- See 12 more
Top Channels
Channels Used
-
website
-
mobile
-
social media
-
phone calls
-
user generated content
-
blogs
-
mobile app
-
video
-
e-mail
-
offline
-
newsletter
-
on premises
-
channel partners
-
point of sale
-
omnichannel
-
mass media
-
television
-
text SMS
-
chat
-
promotions
-
review sites
-
Amazon
-
Instagram
-
print media
-
magazine
-
Netflix
-
events
-
trade shows
-
Facebook
-
LinkedIn
-
games
-
coupons
-
display advertisement
- See 30 more
-
website
-
mobile
-
social media
-
phone calls
-
user generated content
-
blogs
-
mobile app
-
video
-
e-mail
-
offline
-
newsletter
-
on premises
-
channel partners
-
point of sale
-
omnichannel
-
mass media
-
television
-
text SMS
-
chat
-
promotions
-
review sites
-
Amazon
-
Instagram
-
print media
-
magazine
-
Netflix
-
events
-
trade shows
-
Facebook
-
LinkedIn
-
games
-
coupons
-
display advertisement
- See 30 more
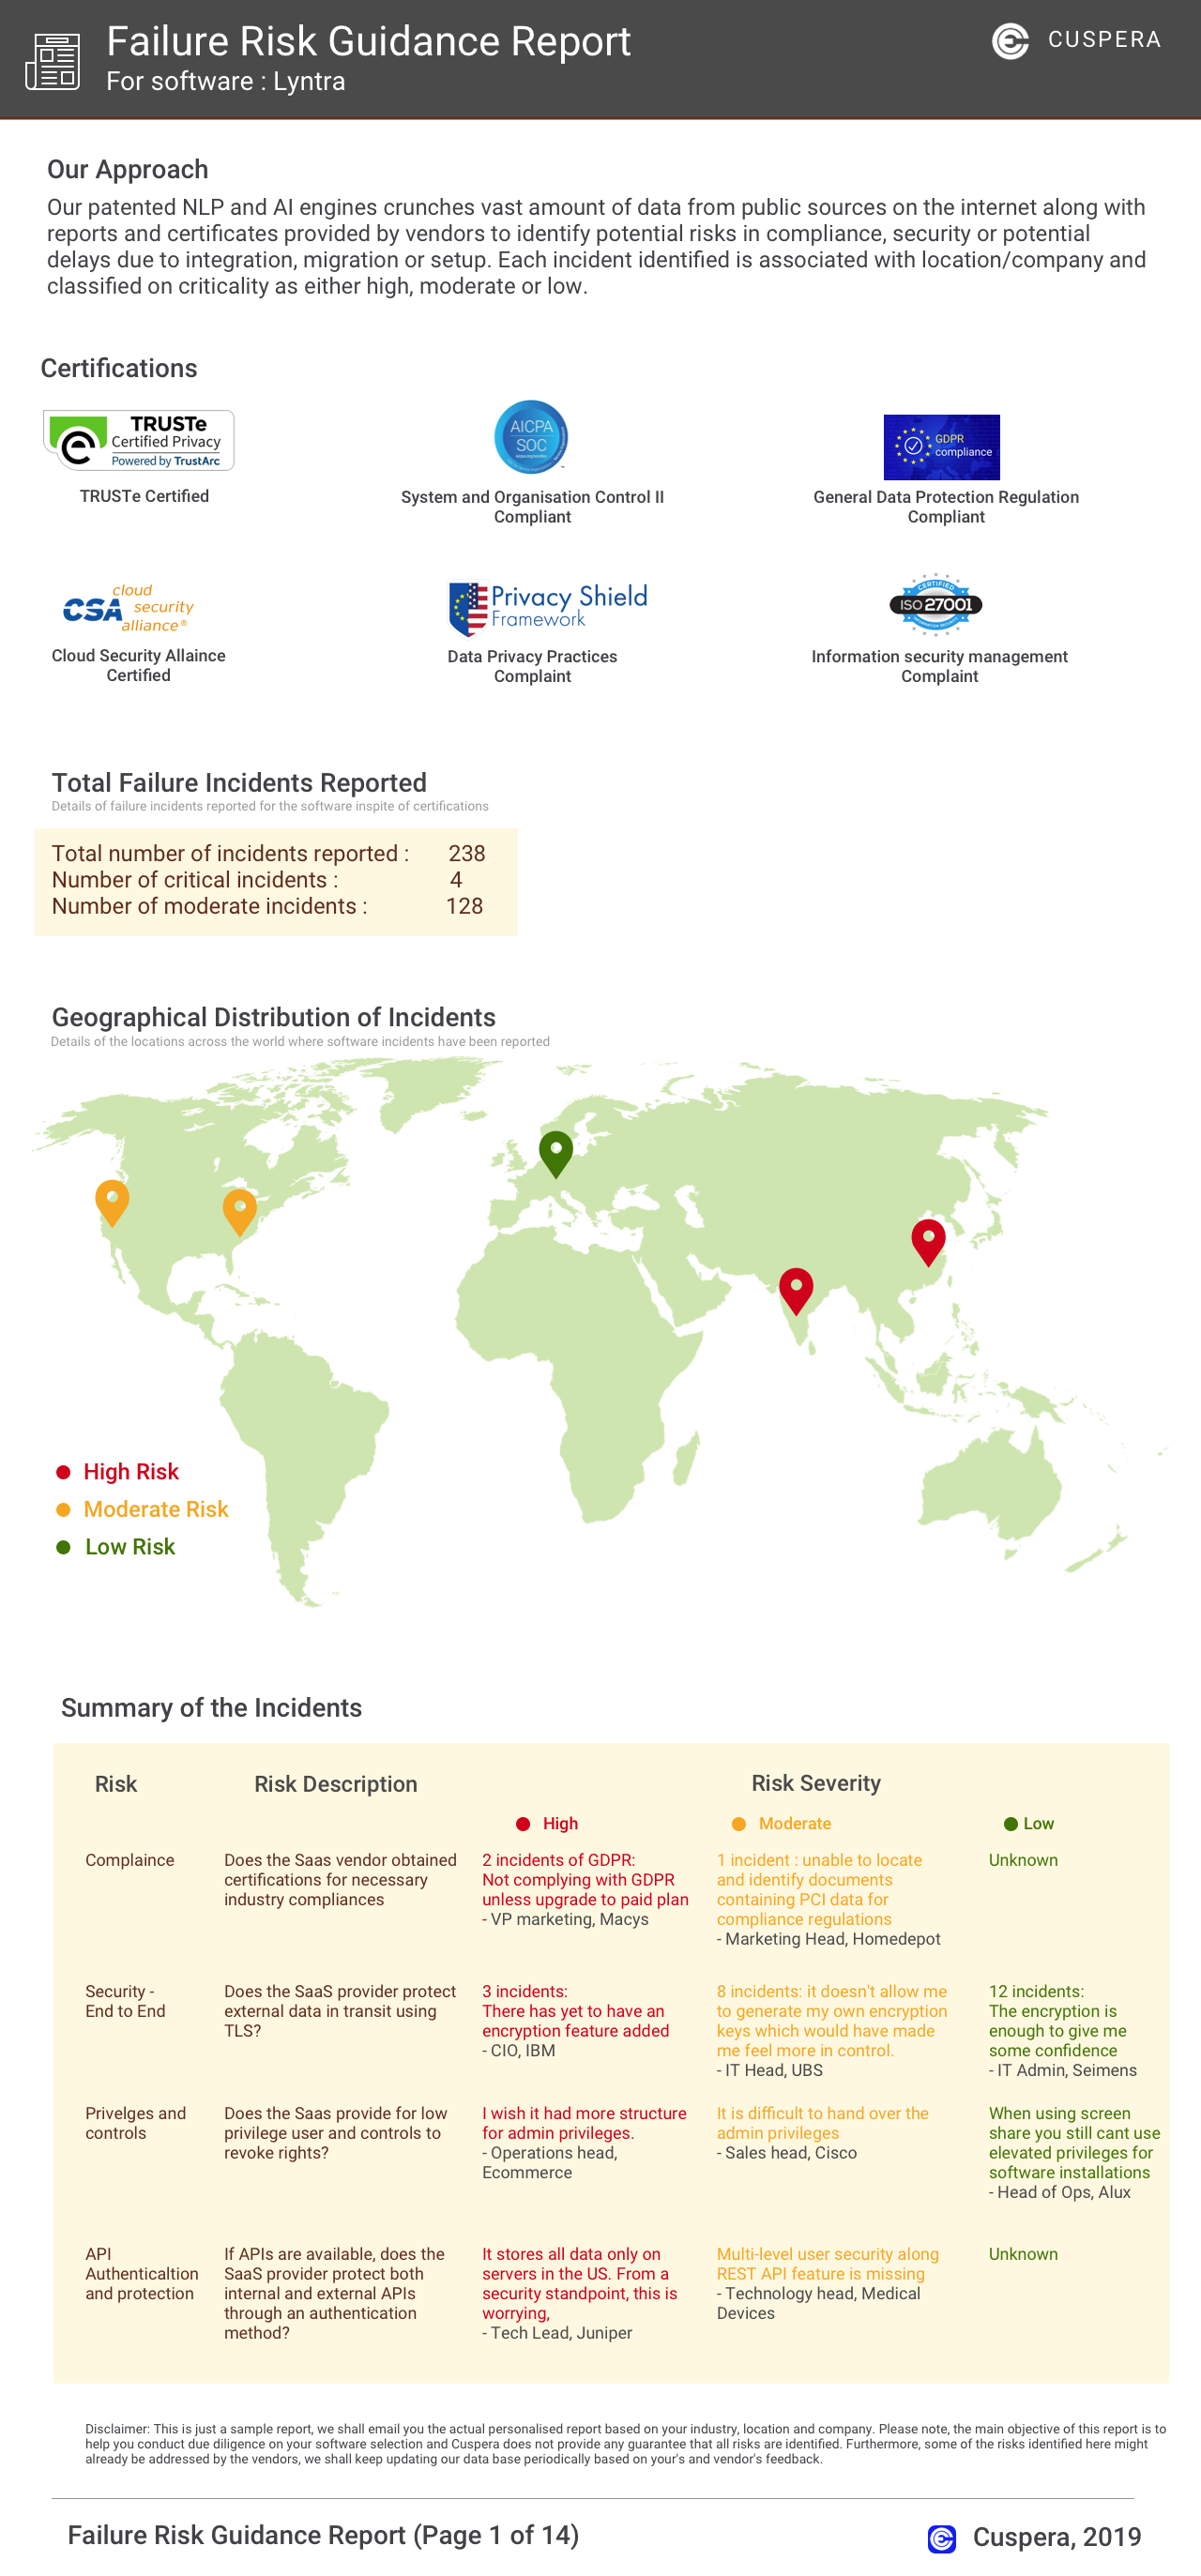
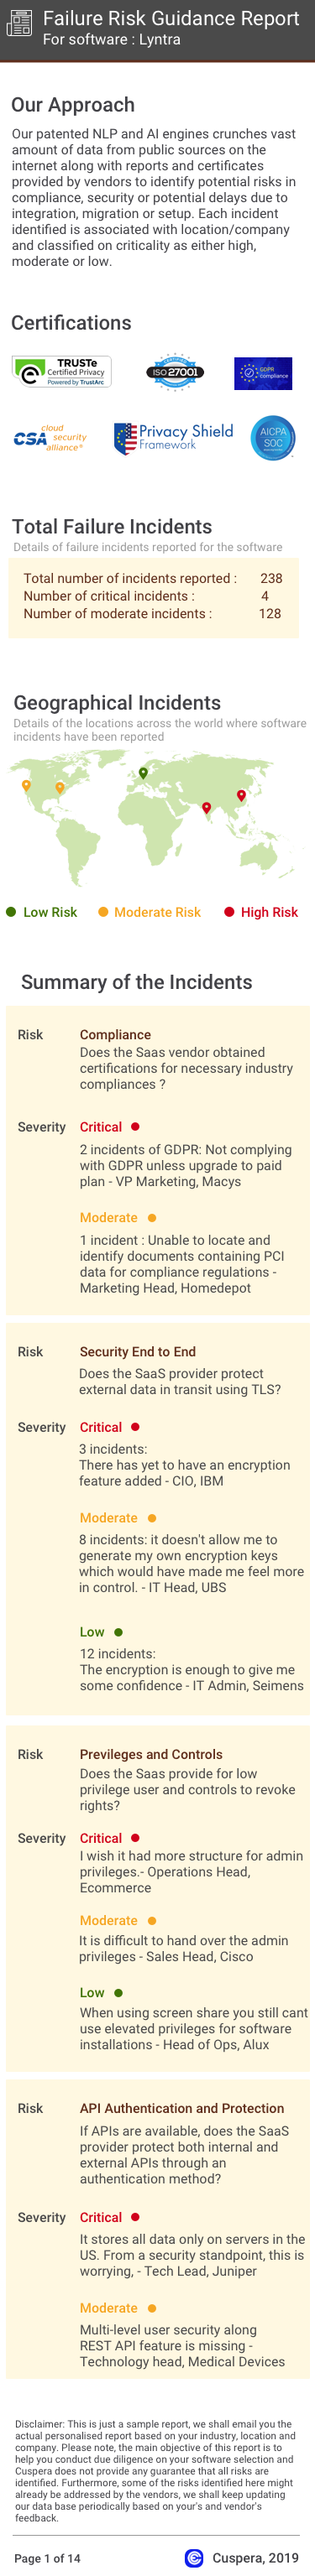
Failure Risk Guidance Security Report?
Compliance Risk
{{{rsh_C_1}}}
{{{rsh_C_1}}}
Security & Privacy Risk
{{{rsh_C_1}}}
{{{rsh_C_1}}}
Integration Risk
{{{rsh_C_1}}}
{{{rsh_C_1}}}
Migration Risk
{{{rsh_C_1}}}
{{{rsh_C_1}}}
IT and Other Capabilities
- Low
- Medium
- High