

Gooddata Analytics Overview
GoodData empowers teams to craft custom data products with AI-driven analytics, seamlessly integrating insights where they're most needed. Ideal for organizations seeking to enhance decision-making, this platform supports building intelligent data applications tailored to specific business needs. Users can deliver critical data insights across various departments, ensuring data-driven strategies are at the forefront of operations. A surprising feature is its capacity to not only control costs but also boost performance, making it a strategic partner in business intelligence. By enabling smarter workflows, GoodData helps businesses add value and increase revenue, positioning itself as a vital tool for forward-thinking companies.
Use Cases
Customers recommend Competitive Intelligence, Engagement Management, Social Media Analytics, as the business use cases that they have been most satisfied with while using Gooddata Analytics.
Business Priorities
Enhance Customer Relationships and Acquire Customers are the most popular business priorities that customers and associates have achieved using Gooddata Analytics.
Gooddata Analytics Use-Cases and Business Priorities: Customer Satisfaction Data
Gooddata Analytics's features include Dashboard, Ticketing, Personalization, etc. and Gooddata Analytics support capabilities include 24/7 Support, Chat Support, Email Support, etc. also Gooddata Analytics analytics capabilities include Analytics, and Custom Reports.
Reviews
"GoodData has given us the edge we needed to break into the market while meeting the needs of our users." - Mike Terry
Peer review evidence (same sources as the product rating summary)
"...Business Intelligence & Analytics Software..." Business Intelligence & Analytics Software | For Every Need | GoodData Overview
"...Comprehensive student analytics and learning analytics to monitor student interactions, engagement, performance to improve student retention, student success and satisfaction Flexibility to deliver dashboards and reports in a number of ways...." Peer review by Chath W., Education
"...The last thing we wanted was to have a competitor begin using analytics and reporting before we did and capture that customer base...." Case Study SalesHood
Gooddata Analytics, Hevo, Phocas, ZAP Data Hub, Striim, etc., all belong to a category of solutions that help Business Intelligence. Each of them excels in different abilities. Therefore, determining the best platform for your business will depend on your specific needs and requirements.
GoodData is an AI-fueled data analytics platform enabling customized data products. Advanced interactive analytics capabilities are provided.
 Ask Wyz
Popular Business Setting
for Gooddata Analytics
Top Industries
- Computer Software
- Information Technology and Services
- Financial Services
Popular in
- Mid Market
- Small Business
- Enterprise
Gooddata Analytics is popular in Computer Software, Information Technology And Services, and Financial Services and is widely used by Mid Market, Small Business, and Enterprise.
Gooddata Analytics Customer wins, Customer success stories, Case studies
Why is Gooddata Analytics the best choice for Competitive Intelligence?
What Are the key features of Gooddata Analytics for Engagement Management?
How efficiently Does Gooddata Analytics manage your Funnel Analysis?
How efficiently Does Gooddata Analytics manage your Workflow Management?
| CUSTOMERS | TESTIMONIALS |
|---|---|
|
|
GoodData has given us the edge we needed to break into the market while meeting the needs of our users. Testimonial By Mike Terry |
|
|
Our users have complete real-time visibility into investment portfolios at their fingertips thanks to the help of integrated technology from GoodData which we embedded into our Investment Lifecycle Management (ILM) decision and risk analytics platform for real assets fund managers. Testimonial By Jason Adams |
| CUSTOMERS | TESTIMONIALS |
|---|---|
|
Mike Terry Business Analyst Say Insurance |
GoodData has given us the edge we needed to break into the market while meeting the needs of our users. Testimonial By Mike Terry |
|
Jason Adams VP Product and Engineering Mercatus Inc |
Our users have complete real-time visibility into investment portfolios at their fingertips thanks to the help of integrated technology from GoodData which we embedded into our Investment Lifecycle Management (ILM) decision and risk analytics platform for real assets fund managers. Testimonial By Jason Adams |
Embedded Analytics: What it is: Methods: & Examples
Frequently Asked Questions(FAQ)
for Gooddata Analytics
What CRM integrations are available with GoodData?
GoodData offers several CRM integrations that enhance its analytics capabilities, allowing businesses to leverage their customer data effectively. Notably, GoodData integrates seamlessly with Salesforce, enabling users to visualize and analyze sales data directly within the GoodData platform. This integration helps organizations gain insights into customer interactions and sales performance. Additionally, GoodData can connect with HubSpot, providing users with the ability to analyze marketing and sales data in one place, facilitating better decision-making. These integrations support a comprehensive view of customer relationships, empowering businesses to drive growth through data-driven strategies. By utilizing these CRM integrations, organizations can enhance their reporting and analytics, ultimately leading to improved customer engagement and satisfaction.
How can I integrate GoodData with my marketing automation platform?
Integrating GoodData with your marketing automation platform can enhance your data analytics capabilities and streamline your marketing efforts. To begin, identify the specific marketing automation platform you are using, such as HubSpot or Marketo, and check for available integrations within GoodData. GoodData supports various embedding types and offers APIs that facilitate seamless integration, allowing you to embed analytics directly into your marketing workflows. You can utilize GoodData’s Intelligent Data Automation features to automate data exports and trigger alerts based on marketing performance metrics. Additionally, leverage the self-service BI capabilities to provide your marketing team with customizable dashboards and insights, ensuring they have access to real-time data for informed decision-making. For detailed guidance, refer to GoodData's documentation or schedule a demo with a representative to explore tailored integration solutions.
What data providers can I connect to using GoodData?
GoodData offers robust connectivity options through its FlexConnect feature, which allows organizations to connect to virtually any data source. This includes popular databases and platforms such as ClickHouse and Amazon Redshift, enabling seamless integration of diverse data sets into your analytics workflows. By leveraging GoodData's API-first headless BI architecture, businesses can execute custom computation logic at runtime, ensuring that they can tailor their analytics to meet specific needs. This flexibility not only enhances data accessibility but also empowers users to derive actionable insights from their data, regardless of its origin. With GoodData, you can effectively unify your data landscape and drive informed decision-making across your organization.
How does the AI Assistant feature work in GoodData?
The AI Assistant feature in GoodData operates on a modern, scalable architecture designed specifically for enterprise use, enabling users to engage with data through natural language queries. This conversational analytics solution allows business users, regardless of their technical expertise, to ask questions and receive precise, governed insights directly within their existing workflows. By leveraging APIs and SDKs, the AI Assistant integrates seamlessly into various applications, providing contextually relevant insights and guided next steps. It employs a model-agnostic architecture that optimizes performance and cost, ensuring that users receive accurate and actionable information while maintaining data governance and security. This functionality drastically reduces time-to-insight, empowering teams to make informed decisions quickly and efficiently.
What are the capabilities of the Agent Builder in GoodData?
The Agent Builder in GoodData is a powerful feature designed to enhance AI-enabled decision-making and embedded analytics within enterprises. It allows users to create and manage customizable AI agents that can operate across various systems, ensuring they are context-aware and governed. The platform supports both no-code and developer-driven approaches, making it accessible for users with varying technical expertise. Key capabilities include the ability to generate intelligence from business data, automate analytics processes, and execute tasks autonomously. Additionally, the Agent Builder facilitates multi-tenant deployments, ensuring scalability and security for enterprise applications. With a strong emphasis on data privacy, all agents inherit a robust philosophy that guarantees traceable and auditable decision paths, ultimately driving efficiency and insight generation in business operations.
How can I set up API access for GoodData?
To set up API access for GoodData, you will need to follow a series of actionable steps. First, ensure you have a GoodData account and access to the GoodData platform. Next, navigate to the API section in your account settings to generate an API token, which will be required for authentication. Once you have your token, you can utilize GoodData's SDKs, such as the React, Python, or JavaScript SDKs, to integrate API calls into your applications. Make sure to review the API documentation provided by GoodData for detailed instructions on endpoints and data handling. Additionally, consider implementing role-based access controls to manage permissions effectively. This setup will enable you to automate processes, access data, and enhance your analytics capabilities seamlessly.
What is the process for configuring GoodData's dashboard plugins?
Configuring GoodData's dashboard plugins involves a straightforward process that empowers users to customize their analytics dashboards without needing extensive support. First, access the GoodData SDK portal to explore the available dashboard plugins and their functionalities. Next, utilize the provided React, Python, or JavaScript SDKs to integrate your custom data and UI widgets into the GoodData dashboards. You can personalize the dashboard by employing drag-and-drop features to modify metrics, add filters, and adjust visualizations according to your specific needs. Additionally, ensure that you manage access and permissions effectively using role-based controls to maintain security. Finally, leverage the self-service capabilities to monitor and audit your dashboard configurations, ensuring a seamless and tailored analytics experience for your users.
How does GoodData's anomaly detection feature function?
GoodData's anomaly detection feature functions by leveraging advanced algorithms that analyze historical data patterns to identify deviations from expected trends. This capability is integrated within the GoodData platform, allowing users to automatically monitor key metrics and receive alerts when anomalies occur, such as unexpected spikes or drops in data. The feature utilizes the intelligent semantic layer to ensure that the insights generated are grounded in the business context, providing users with actionable information that is both reliable and relevant. By enabling businesses to quickly spot and address anomalies, GoodData enhances decision-making processes and helps organizations maintain operational efficiency, ultimately driving better outcomes and reducing risks associated with data inconsistencies.
What role-based controls does GoodData offer for managing access?
GoodData offers robust role-based controls that enable organizations to manage access and permissions effectively within their analytics environment. These controls allow administrators to define user roles and assign specific permissions based on individual responsibilities, ensuring that team members have access only to the data and functionalities necessary for their roles. This granular approach enhances security by minimizing the risk of unauthorized access to sensitive information. Additionally, GoodData's multi-tenant workspace isolation further strengthens security by separating data and user environments, making it suitable for enterprise-scale applications. By implementing these role-based controls, organizations can maintain compliance, streamline collaboration, and foster a secure analytics ecosystem that supports both self-service insights and governed data usage.
How can I embed GoodData analytics into my applications?
To embed GoodData analytics into your applications, you can utilize various embedding options tailored to your needs, including no-code, low-code, and full-code approaches. GoodData provides SDKs for React, Python, and JavaScript, allowing you to seamlessly integrate dashboards, reports, and data visualizations directly into your platform. You can choose between iFrame embedding for quick setups or utilize the APIs for more customized solutions. Additionally, the platform supports single sign-on (SSO) for secure access and role-based controls to manage permissions effectively. By leveraging GoodData's multitenancy capabilities, you can scale your analytics across multiple users and customers while maintaining a consistent and branded user experience. This flexibility ensures that you can deliver insightful analytics that enhance user engagement and drive informed decision-making.
What programming languages are supported by GoodData's SDKs?
GoodData's SDKs support a variety of programming languages, specifically designed to cater to developers' needs for flexibility and integration. The primary languages supported include React, Python, and JavaScript, allowing developers to build applications using their preferred technology stack. This multi-language support enables seamless integration of GoodData's analytics capabilities into existing applications, whether through all-code, low-code, or no-code interfaces. By leveraging these SDKs, businesses can create customized, modern applications that deliver insights quickly and efficiently, enhancing user experience and operational efficiency. This versatility in programming languages ensures that organizations can adopt GoodData's solutions without being constrained by their existing development frameworks.
How does the Visualization Builder in GoodData help users create dashboards?
The Visualization Builder in GoodData empowers users to create dynamic dashboards with ease, utilizing a drag-and-drop interface that simplifies the process of customizing data visualizations. Users can effortlessly change metrics, dimensions, and visualization types from a variety of out-of-the-box options, allowing for tailored insights that meet specific business needs. Additionally, the ability to add filters to entire dashboards or individual visualizations enhances the interactivity and depth of data exploration. This self-service capability not only accelerates the dashboard creation process but also enables users, regardless of their technical expertise, to derive actionable insights quickly. By streamlining the visualization process, GoodData enhances decision-making and drives growth through effective data storytelling.
What are the benefits of using GoodData's Metrics Layer?
GoodData's Metrics Layer offers several key benefits that enhance business intelligence and analytics capabilities. It allows users to create custom metrics tailored to their specific needs, enabling more precise data analysis and reporting. The user-friendly interface, featuring drag-and-drop functionality, simplifies the onboarding process for various personas, making it accessible for both technical and non-technical users. Additionally, the Metrics Layer supports self-service business intelligence, empowering users to generate insights and dashboards independently. This flexibility is complemented by robust documentation and technical support, ensuring that users can effectively leverage the platform. Overall, GoodData's Metrics Layer drives efficiency and innovation by providing a scalable solution that integrates seamlessly with existing data sources, ultimately fostering data-driven decision-making across organizations.
How can I automate workflows using GoodData's APIs?
To automate workflows using GoodData's APIs, you can leverage the platform's robust API capabilities to programmatically create and manage workflows tailored to your business needs. Start by accessing the GoodData API documentation, which provides detailed guidance on available endpoints and functionalities. You can utilize the APIs to schedule exports, trigger alerts, and embed analytics directly into your applications. Additionally, GoodData supports various SDKs, including React, Python, and JavaScript, allowing you to implement automation in a way that fits your development environment, whether through all-code, low-code, or no-code approaches. By integrating these automated workflows into your existing systems, you can enhance operational efficiency and ensure timely delivery of insights across your organization.
What is the significance of multi-tenant workspace isolation in GoodData?
Multi-tenant workspace isolation in GoodData is a crucial feature that enhances security and efficiency for organizations managing multiple clients or departments. This architecture allows businesses to create separate environments for each tenant, ensuring that data and analytics are securely isolated while still being managed from a centralized platform. This isolation not only protects sensitive information but also simplifies maintenance and updates, as changes can be pushed across all child tenant workspaces automatically. Additionally, it supports scalability, enabling organizations to grow their data monetization efforts seamlessly as their customer base expands. By leveraging multi-tenant workspace isolation, companies can provide tailored analytics solutions while maintaining robust security and compliance, ultimately driving trust and satisfaction among users.
How does GoodData ensure data security during integrations?
GoodData ensures data security during integrations through a comprehensive approach that includes DevSecOps practices, where data is encrypted both at rest and in transit. This security framework is designed to comply with industry standards such as SOC 2 Type II, ISO 27002, and HIPAA, making it suitable for organizations handling sensitive information. Additionally, GoodData implements strong multitenancy controls to isolate data across different clients, ensuring that access is tightly managed and monitored. The platform also features role-based access controls, allowing organizations to manage permissions effectively. By providing a secure environment for data integration, GoodData enables businesses to confidently leverage analytics while maintaining compliance and protecting their data integrity.
What customization options are available for GoodData dashboards?
GoodData offers extensive customization options for dashboards, allowing users to create a tailored analytics experience that aligns with their brand identity. Users can adjust visual elements such as color palettes, fonts, and logos to ensure a seamless white-labeled experience. The platform also supports dashboard plugins, enabling enhanced capabilities for personalization without requiring GoodData support. Additionally, the drag-and-drop interface allows users to modify metrics, dimensions, and visualization types easily, while filters can be applied to entire dashboards or individual visualizations. This level of flexibility empowers businesses to deliver self-service insights and analytics that meet their specific needs, ultimately driving user engagement and satisfaction.
How can I monitor automation activity in GoodData?
To monitor automation activity in GoodData, you can utilize the centralized dashboard that provides comprehensive oversight of all automation processes. This dashboard allows you to track scheduled exports, event-based alerts, and other automated workflows in real-time. Additionally, GoodData incorporates robust auditing features that enable you to review the history of automation activities, ensuring transparency and accountability. By leveraging role-based controls, you can manage access to this information, allowing only authorized users to view specific automation details. This level of monitoring not only enhances security but also helps in optimizing your data workflows by identifying any issues or inefficiencies promptly. Overall, GoodData's monitoring capabilities empower businesses to maintain control over their automated processes effectively.
What features does GoodData offer for self-service insights?
GoodData offers a robust suite of features designed to empower users with self-service insights, making data analysis accessible and intuitive. Key functionalities include customizable dashboards and metrics that allow users to filter and visualize data according to their specific needs. The platform supports various development environments with SDKs for React, Python, and JavaScript, enabling seamless integration into existing applications. Additionally, GoodData provides single sign-on (SSO) for secure access, along with low-code and no-code options to cater to users with varying technical skills. The platform also incorporates advanced capabilities like forecasting and pattern finding, which help users identify trends and anomalies in their data. Overall, these features enhance decision-making and drive business growth by enabling users to derive actionable insights independently.
How does the Analytics as Code feature work in GoodData?
The Analytics as Code feature in GoodData allows users to build and manage analytics solutions using code, which enhances collaboration and accelerates development. By leveraging YAML templates and REST APIs, teams can create insights, dashboards, and datasets in a code-first manner, promoting best practices from software development. This approach enables rapid iteration and deployment, as users can automate testing and deployment processes, ensuring high-quality analytics solutions. Additionally, GoodData integrates seamlessly with development environments like VS Code, allowing for enhanced coding capabilities and collaboration through platforms such as GitHub or GitLab. This feature not only streamlines the analytics development process but also supports scalability, enabling organizations to manage growing data volumes and user demands effectively.
What are the use cases for GoodData's advanced workflow integrations?
GoodData's advanced workflow integrations are designed to enhance operational efficiency and data-driven decision-making across various business scenarios. Use cases include embedding analytics directly into existing applications, enabling self-service business intelligence for brand partners, and automating data workflows through Intelligent Data Automation. This allows organizations to schedule exports, trigger alerts, and deliver insights seamlessly within their workflows. Additionally, GoodData integrates with popular tools like Slack and Salesforce, facilitating real-time collaboration and communication. By leveraging GoodData's capabilities, businesses can provide rich data visualizations, forecast trends, and uncover patterns, ultimately driving growth and improving user engagement. These integrations empower teams to access actionable insights without needing deep technical expertise, making data more accessible and impactful.
How can I leverage GoodData's AI-driven business intelligence capabilities?
To leverage GoodData's AI-driven business intelligence capabilities, start by integrating the GoodData AI Assistant into your existing workflows using its APIs and SDKs. This powerful tool allows users to engage with data through natural language queries, providing instant insights tailored to your business context. Utilize the self-service BI features to empower your team and brand partners with customizable dashboards, metrics, and visualizations that enhance data accessibility. Additionally, take advantage of forecasting and pattern-finding capabilities to identify trends and anomalies in your data, enabling informed decision-making. By embedding these analytics into your online platform, you can create a seamless user experience while ensuring compliance and governance, ultimately driving growth and efficiency in your organization.
What is the process for creating custom agents in GoodData?
Creating custom agents in GoodData involves utilizing the Agent Builder feature, which allows users to develop AI-enabled analytics agents tailored to specific business needs. The process begins by accessing the GoodData platform, where users can choose between a no-code or code-first approach to build their agents. The platform provides prebuilt templates and a semantic layer to streamline development. Users can configure the agents to operate across various systems, ensuring they are context-aware and governed. Once the agents are built, they can be deployed quickly and securely, with centralized management for monitoring and auditing. GoodData's forward-deployed engineers are also available to assist in designing and launching these custom agents, ensuring a fast time-to-value for businesses.
How does GoodData support low-code or no-code development?
GoodData supports low-code and no-code development through its user-friendly interfaces and pre-built components, allowing users to create modern, mobile-first applications without extensive coding knowledge. The platform offers a no-code UI framework that simplifies the analytics building process, enabling users to assemble applications like building blocks while GoodData automatically generates the necessary queries. Additionally, GoodData provides SDKs for React, Python, and JavaScript, catering to developers who prefer a code-based approach. This flexibility ensures that both technical and non-technical users can leverage the platform effectively, promoting collaboration and accelerating deployment times. With GoodData, organizations can achieve faster insights and deliver tailored analytics solutions to their teams and customers, enhancing overall productivity and efficiency.
What are the key features of GoodData's cloud offering?
GoodData's cloud offering includes a robust set of key features designed to enhance analytics and business intelligence capabilities. It provides a code-first approach through Analytics as Code, allowing users to build insights and dashboards using YAML templates or REST APIs. The platform supports multiple SDKs, including React, Python, and JavaScript, enabling seamless integration into various tech stacks. GoodData also offers a low-code/no-code UI for users who prefer a more visual approach, alongside self-service insights and dashboards. Security is prioritized with role-based access controls and multi-tenant workspace isolation, ensuring secure enterprise-scale automation. Additionally, the platform features CI/CD capabilities, versioning, and testing, making it suitable for agile development environments. Overall, GoodData's cloud solution empowers organizations to make data-informed decisions and monetize data products effectively.
How can I use GoodData to improve my team's analytics capabilities?
To improve your team's analytics capabilities with GoodData, start by leveraging its embedded analytics features, which allow you to integrate rich data visualizations directly into your applications, providing a seamless user experience. Utilize the self-service BI tools to empower team members with access to customizable dashboards, metrics, and data visualizations, enabling them to explore insights independently. Additionally, take advantage of GoodData's forecasting and pattern-finding capabilities to identify trends and anomalies in your data, enhancing decision-making processes. Implement role-based access controls to ensure secure data management while promoting collaboration through its low-code and no-code options. By centralizing data and automating analytics processes, GoodData can help your team work more efficiently and effectively, driving better business outcomes.
What are the options for embedding analytics in GoodData?
GoodData offers several options for embedding analytics, catering to various development needs and user experiences. You can choose from no-code, low-code, or full-code approaches, allowing flexibility based on your technical expertise and project requirements. The platform supports embedding through iFrames or SDKs, including specialized SDKs for React, Python, and JavaScript, which are ideal for different application frameworks. Additionally, GoodData provides role-based access controls and multi-tenant workspace isolation to ensure secure and scalable analytics deployment. This versatility enables you to integrate dashboards, reports, and data visualizations seamlessly into your applications, enhancing user engagement and providing self-service insights tailored to your brand's needs.
How does GoodData handle versioning and testing for analytics projects?
GoodData manages versioning and testing for analytics projects through a robust framework designed for DataOps, which includes features such as automated testing, version control, and rollback capabilities. This ensures that all elements of your analytics, including dashboards and insights, can be versioned and merged seamlessly. The platform allows for code-based automation, enabling teams to implement software development best practices in their analytics workflows. By utilizing APIs, SDKs, and blueprints, GoodData facilitates rapid creation and deployment of analytics environments while maintaining governance and control. This structured approach not only enhances collaboration among teams but also ensures that any changes can be thoroughly tested and validated before being rolled out to production, minimizing disruptions and maintaining the integrity of analytics projects.
What is the role of the centralized dashboard in GoodData?
The centralized dashboard in GoodData serves as a pivotal tool for managing and monitoring analytics across an organization. It consolidates data from various sources into a unified view, allowing users to access real-time insights and metrics efficiently. This dashboard enhances trust by providing role-based controls for managing access and permissions, ensuring that sensitive information is securely handled. Additionally, it supports enterprise-scale automation with multi-tenant workspace isolation, enabling organizations to maintain governance while scaling their analytics efforts. By centralizing monitoring and auditing of automation activities, the dashboard empowers teams to make informed decisions quickly, driving growth and operational efficiency. Overall, the centralized dashboard is essential for fostering a data-driven culture and ensuring consistent, reliable analytics across the organization.
How can I customize data products for multiple customers using GoodData?
To customize data products for multiple customers using GoodData, you can leverage its robust white labeling and customization features. GoodData allows you to fully tailor dashboards to align with your brand by adjusting color palettes, fonts, logos, and other visual elements, ensuring a seamless experience for your users. Additionally, the platform supports multitenancy, enabling you to build analytics once and share them across your entire customer base. This means you can manage customer-specific analytics in one centralized location, applying changes in the admin environment that automatically roll out to all users. By utilizing GoodData's self-service BI capabilities, you can empower your customers to access and manipulate their data visualizations, further enhancing the customization experience.
What are the business benefits of using BI and analytics for my insurance company?
Business Intelligence (BI) and analytics provide significant advantages for insurance companies by enhancing decision-making and operational efficiency. Firstly, these tools enable thorough risk assessment through the analysis of extensive data sets, leading to more accurate underwriting decisions and improved fraud detection. Additionally, BI and analytics streamline processes and automate routine tasks, which boosts operational efficiency and reduces costs. They also facilitate personalized customer experiences by analyzing customer data, allowing insurers to tailor products and services to meet individual needs. Furthermore, leveraging analytics can help in understanding customer behavior, predicting churn, and optimizing retention strategies, ultimately driving growth and profitability for the insurance company. Overall, integrating BI and analytics into your operations can transform how your company manages risks, engages with customers, and improves overall performance.
How can analytics improve underwriting decisions in the insurance industry?
Analytics can significantly improve underwriting decisions in the insurance industry by leveraging extensive data analysis to assess risks more accurately. Tools like GoodData's Underwriting DecisionBench™ consolidate data from multiple sources, providing underwriters with a comprehensive view of submissions and enabling them to prioritize effectively. By utilizing AI-driven insights, underwriters can identify patterns that may indicate potential fraud or high-risk applicants, leading to more informed decision-making. Additionally, analytics streamline the underwriting process by automating routine tasks, allowing underwriters to focus on strategic evaluations rather than administrative work. This not only enhances operational efficiency but also improves the overall accuracy of underwriting decisions, ultimately leading to better risk management and profitability for insurance companies.
What measurable outcomes can my business expect from implementing marketing analytics tools?
Implementing marketing analytics tools can lead to several measurable outcomes that significantly enhance business performance. Firstly, businesses can expect improved campaign effectiveness through actionable insights that allow for data-driven decision-making, resulting in higher conversion rates and ROI. By tracking key metrics such as traffic, click-through rates, and customer acquisition costs, companies can optimize their marketing strategies and allocate resources more efficiently. Additionally, marketing analytics tools facilitate the identification of high-performing channels and content, enabling businesses to focus their efforts on what drives the most engagement and sales. Over time, these tools can also enhance customer retention and lifetime value by providing insights into user behavior and preferences, ultimately leading to a more tailored and effective marketing approach.
How does analytics help in detecting fraud within insurance claims?
Analytics plays a crucial role in detecting fraud within insurance claims by leveraging data analysis and statistical modeling to identify patterns and anomalies that may indicate fraudulent activity. By analyzing extensive datasets, including historical claims data and external information, analytics can uncover inconsistencies and red flags that might go unnoticed in manual reviews. For instance, predictive models can assign priority scores to fraud referrals, helping claims managers and Special Investigations Units (SIUs) focus on the most suspicious cases. Additionally, GoodData's Claims Insights solution enhances this process by providing an end-to-end view of claims, allowing for timely insights and recommendations on the next best actions to take. This proactive approach not only improves fraud detection but also enhances overall operational efficiency and customer satisfaction within the insurance industry.
What is the ROI of using advanced analytics in operational efficiency?
The ROI of using advanced analytics in operational efficiency can be substantial, as it enables organizations to identify inefficiencies, optimize processes, and reduce costs. By leveraging data-driven insights, businesses can streamline operations, enhance productivity, and improve decision-making. For instance, advanced analytics can uncover patterns in operational data, allowing companies to predict maintenance needs, optimize resource allocation, and enhance supply chain management. This leads to reduced downtime and increased throughput, ultimately translating into higher profitability. Companies that have implemented advanced analytics often report significant returns, such as Fourth, which realized a 117% ROI by integrating analytics into its operations. Thus, investing in advanced analytics not only improves operational efficiency but also contributes to a stronger bottom line.
How can I calculate the cost savings from implementing a marketing analytics tool?
To calculate the cost savings from implementing a marketing analytics tool, start by assessing your current marketing expenses and the inefficiencies in your campaigns. Identify key metrics such as conversion rates, customer acquisition costs, and ROI before implementation. After deploying the marketing analytics tool, track improvements in these metrics over time. For instance, if the tool helps increase conversion rates or reduce customer acquisition costs, quantify these changes in monetary terms. Additionally, consider the time saved by automating data collection and reporting, which can be translated into labor cost savings. Finally, compare the total costs of the analytics tool against the financial benefits gained from optimized marketing strategies, allowing you to determine the overall cost savings and return on investment from using the tool.
What pricing plans are available for business intelligence software?
GoodData offers flexible and scalable pricing plans tailored to meet various analytics needs. Their primary plan is the Professional plan, which features per-workspace pricing that includes a platform fee plus the number of workspaces required. This plan allows for unlimited users and data, making it suitable for businesses looking to scale as they grow. Additionally, GoodData provides a 30-day free trial, enabling potential users to explore the platform's analytics features and business intelligence capabilities before committing. By evaluating these pricing options, businesses can select a plan that aligns with their specific requirements for analytics, data products, and embedded agents, ensuring they get the best value for their investment in business intelligence software.
How does customer segmentation analytics impact revenue growth?
Customer segmentation analytics significantly impacts revenue growth by enabling businesses to tailor their marketing strategies and product offerings to specific customer groups. By analyzing customer behavior, preferences, and demographics, companies can identify high-value segments and create targeted campaigns that resonate with these audiences. This personalized approach not only enhances customer engagement and satisfaction but also increases conversion rates, as tailored messages are more likely to attract and retain customers. Furthermore, segmentation allows businesses to optimize pricing strategies and promotional offers based on the unique characteristics of each segment, maximizing revenue potential. Ultimately, leveraging customer segmentation analytics leads to more efficient resource allocation, improved customer lifetime value, and sustained revenue growth.
What is the total cost of ownership for implementing analytics solutions?
The total cost of ownership (TCO) for implementing analytics solutions encompasses several factors, including initial setup costs, ongoing maintenance, and operational expenses. Key components of TCO include software licensing fees, hardware costs, data storage expenses, and the resources required for integration and training. Additionally, organizations should consider the costs associated with data governance, compliance, and potential upgrades as their analytics needs evolve. For instance, platforms that support multi-tenancy may offer cost efficiencies by allowing organizations to serve multiple clients from a single environment, thus reducing overhead. Ultimately, understanding TCO helps businesses evaluate the long-term financial implications of their analytics investments, ensuring they choose a solution that aligns with their budget and strategic goals.
How quickly can I expect to see value from a new analytics tool?
The time it takes to see value from a new analytics tool can vary based on several factors, including the complexity of the tool, the quality of data integration, and the specific use case. Generally, businesses can expect to start seeing actionable insights within a few weeks to a couple of months after implementation. For instance, tools like GoodData and Stackless are designed to accelerate time to value by offering prebuilt pipeline blueprints and user-friendly interfaces, which can help teams quickly adapt and utilize the analytics capabilities. Additionally, organizations that invest time in training and aligning their teams around the analytics tool will likely experience faster results, as they can effectively leverage the insights to inform decision-making and optimize operations.
What are the key metrics to measure ROI from marketing analytics?
To measure ROI from marketing analytics effectively, businesses should focus on several key metrics that provide insights into campaign performance. These include conversion rates, which indicate the percentage of users who take a desired action; click-through rates, reflecting the effectiveness of marketing messages in driving traffic; and cost per acquisition (CPA), which measures the total cost of acquiring a new customer. Additionally, tracking customer lifetime value (CLV) helps businesses understand the long-term value generated from marketing investments. By analyzing these metrics through a marketing analytics tool, companies can make data-driven decisions to optimize their strategies, ultimately enhancing their ROI and ensuring that marketing efforts align with business objectives.
How can analytics enhance customer experiences in my business?
Analytics can significantly enhance customer experiences in your business by providing deep insights into customer behavior, preferences, and feedback. By utilizing customer service analytics tools, you can analyze interactions and sentiments to identify trends and pain points, allowing you to tailor your services and offerings to meet customer needs more effectively. Advanced analytics, including predictive analytics, can help anticipate customer issues and streamline support processes, leading to quicker response times and improved satisfaction. Additionally, by monitoring key metrics, you can optimize your operations, reduce backlogs, and ensure that your team is adequately staffed to handle customer inquiries. Ultimately, leveraging analytics empowers you to create a more personalized and responsive customer experience, fostering loyalty and driving growth.
What are the different tiers of pricing for analytics software?
GoodData offers flexible and scalable pricing plans tailored to various analytics needs, allowing businesses to choose the best fit for their requirements. The primary tier is the Professional plan, which operates on a per-workspace pricing model, including a platform fee plus the number of workspaces. This plan supports unlimited users and data, enabling businesses to scale as they grow. It also provides comprehensive analytics features and business intelligence (BI) capabilities, along with full embedding functionality for seamless integration into existing applications. Additionally, GoodData offers a 30-day free trial, allowing potential users to explore the platform before committing to a plan. This tiered approach ensures that organizations can select a pricing structure that aligns with their specific analytics goals and budget.
How can I optimize my marketing efforts using analytics insights?
To optimize your marketing efforts using analytics insights, start by implementing a robust marketing analytics tool like GoodData, which provides actionable insights into campaign performance. Begin by defining key performance indicators (KPIs) such as conversion rates, click-through rates, and return on investment (ROI). Use these metrics to analyze the effectiveness of different marketing channels and strategies. Leverage AI-powered analytics to identify patterns in customer behavior and preferences, allowing for more targeted campaigns. Regularly review and adjust your marketing strategies based on the insights gained, ensuring that you allocate resources effectively to high-performing channels. Additionally, consider integrating your analytics tool with platforms like Salesforce or HubSpot to streamline data collection and enhance your decision-making process. This data-driven approach will help you refine your marketing tactics and ultimately drive better results.
What implementation costs should I consider when adopting BI tools?
When adopting Business Intelligence (BI) tools, several implementation costs should be considered to ensure a smooth transition and effective utilization. First, evaluate the licensing fees associated with the BI tool, which can vary significantly based on the vendor and the features included. Additionally, factor in costs for integration with existing systems, such as CRM platforms like Salesforce or marketing tools like Google Analytics, as these may require additional resources or third-party services. Training expenses are also crucial, as team members will need to learn how to navigate the new tool effectively; investing in user-friendly platforms can mitigate these costs. Lastly, consider ongoing maintenance and support fees, which are essential for keeping the BI tool updated and functional over time. By accounting for these costs, you can better prepare for a successful BI tool implementation.
How does dynamic pricing through analytics affect revenue optimization?
Dynamic pricing through analytics significantly enhances revenue optimization by allowing businesses to adjust their prices in real-time based on various factors such as demand, competitor pricing, and customer behavior. By leveraging AI-powered dynamic pricing models, companies can identify the most profitable menu items and optimize seating arrangements to maximize revenue. This approach enables businesses to respond swiftly to market changes, ensuring that prices reflect current demand levels, which can lead to increased sales and improved customer satisfaction. Additionally, predictive analytics can forecast demand trends, allowing businesses to proactively manage inventory and pricing strategies. Overall, dynamic pricing not only boosts revenue but also enhances operational efficiency, making it a vital strategy for businesses looking to thrive in competitive markets.
What are the benefits of using customer journey analytics?
Customer journey analytics provides significant benefits for businesses by offering a comprehensive understanding of customer interactions throughout their buying journey. This analytical approach enables organizations to identify key touchpoints, preferences, and pain points, allowing for the optimization of customer experiences. By leveraging insights from customer behavior and sentiment analysis, businesses can tailor their marketing strategies and improve engagement, ultimately increasing customer satisfaction and loyalty. Additionally, customer journey analytics helps in forecasting attrition and understanding churn, enabling proactive measures to retain clients. The ability to analyze data across multiple channels ensures a unified view of customer interactions, which aids in making informed decisions that enhance overall business performance and drive growth.
How can I leverage analytics for better claims management in insurance?
To leverage analytics for better claims management in insurance, you can utilize tools like GoodData's Claims Insights, which provides an end-to-end analytics solution specifically designed to enhance the claims process. Start by integrating your internal and external claims data to gain a comprehensive view of each claim, allowing for more informed decision-making. Use predictive analytics to identify potential fraud and prioritize claims based on risk scores, which can streamline investigations and improve efficiency. Additionally, implement machine learning algorithms to generate next-best-action recommendations, helping claims managers determine the most effective steps to take at each phase of the claim. By automating routine tasks and delivering actionable insights to adjusters and managers, you can enhance customer satisfaction and operational efficiency in your claims management process.
What factors influence the ROI of analytics in business operations?
The ROI of analytics in business operations is influenced by several key factors. First, the clarity of defined objectives and key performance indicators (KPIs) is crucial, as these guide the analytics strategy and ensure alignment with business goals. Second, the quality and relevance of the data being analyzed play a significant role; accurate, timely data leads to more reliable insights. Third, the choice of analytics tools and their features, such as data visualization and predictive analytics capabilities, can enhance decision-making efficiency. Additionally, user adoption and the ease of use of these tools impact how effectively teams can leverage insights. Finally, the ability to integrate analytics into existing workflows and processes ensures that insights are actionable, ultimately driving improvements in operational efficiency and profitability.
How can I assess the effectiveness of my marketing campaigns using analytics?
To assess the effectiveness of your marketing campaigns using analytics, start by defining key performance indicators (KPIs) that align with your business objectives, such as conversion rates, click-through rates, and return on investment (ROI). Utilize marketing analytics tools like Google Analytics or GoodData to gather data on user behavior, traffic sources, and engagement metrics. These platforms allow you to track campaign performance in real-time and compare results across different channels, providing a unified view of your marketing efforts. Additionally, set up dashboards to visualize data trends and configure alerts for specific targets, enabling proactive adjustments to your strategies. By analyzing this data, you can identify successful tactics, optimize underperforming campaigns, and make informed decisions to enhance overall marketing effectiveness.
What are the advantages of using workforce performance analytics?
Workforce performance analytics offers several advantages that can significantly enhance organizational effectiveness. By leveraging data-driven insights, businesses can identify performance drivers, optimize employee productivity, and improve overall workforce engagement. These analytics tools enable HR teams to analyze key metrics related to employee performance, satisfaction, and productivity, allowing for targeted interventions that foster a more motivated workforce. Additionally, workforce performance analytics can streamline performance management processes by providing real-time feedback and facilitating better talent acquisition strategies through data on recruitment channels and hiring outcomes. Ultimately, implementing workforce performance analytics not only drives better decision-making but also aligns HR processes with broader business objectives, leading to improved outcomes and a more efficient workforce.
How can analytics help in resource optimization for my business?
Analytics can significantly enhance resource optimization for your business by providing actionable insights into operational data. By analyzing metrics related to staff scheduling, inventory management, and maintenance planning, you can identify inefficiencies and bottlenecks that may be hindering productivity. For instance, predictive analytics can forecast demand, allowing you to allocate resources more effectively and reduce waste. Additionally, workforce analytics can help assess employee performance and optimize staffing levels based on actual needs, ensuring that you have the right number of employees at peak times. Overall, leveraging analytics enables you to make informed decisions that streamline processes, reduce costs, and ultimately improve your bottom line.
What is the impact of pricing analytics on business profitability?
Pricing analytics involves the use of data analysis to determine optimal pricing strategies that maximize profitability while meeting customer demand. By leveraging historical sales data, competitor pricing, and market trends, businesses can make informed decisions about pricing adjustments in real time. This approach allows companies to respond swiftly to changes in customer behavior and market conditions, ensuring that prices reflect the perceived value of products or services. The impact on business profitability is significant; effective pricing analytics can lead to increased sales, improved margins, and enhanced customer satisfaction by offering competitive prices. Ultimately, businesses that utilize pricing analytics can better align their pricing strategies with market dynamics, resulting in a more robust bottom line and sustainable growth.
How can I use customer lifetime value analytics to drive revenue?
Customer lifetime value (CLV) analytics is a powerful tool for driving revenue by providing insights into the total value a customer brings to your business over their entire relationship. To leverage CLV analytics effectively, start by calculating the average revenue per user (ARPU) and the average customer lifespan. Use this data to segment your customers based on their CLV, allowing you to tailor marketing strategies and retention efforts to high-value segments. Implement targeted campaigns that focus on upselling and cross-selling to these customers, enhancing their experience and increasing their lifetime value. Additionally, monitor changes in CLV over time to identify trends and adjust your strategies accordingly, ensuring that you maximize revenue opportunities while fostering customer loyalty. By integrating CLV analytics into your overall business strategy, you can make informed decisions that directly contribute to revenue growth.
What are the challenges in measuring the ROI of analytics tools?
Measuring the ROI of analytics tools can present several challenges for businesses. One significant hurdle is the difficulty in attributing specific revenue gains directly to the use of analytics, as multiple factors can influence outcomes. Additionally, organizations may struggle with defining clear metrics and KPIs that accurately reflect the value generated by these tools, leading to inconsistent evaluations. The complexity of integrating analytics into existing workflows can also hinder the realization of benefits, as employees may require training to effectively utilize the tools. Furthermore, the initial costs of implementing analytics solutions can be substantial, making it challenging to assess long-term value against upfront investments. To overcome these challenges, businesses should establish a robust framework for measuring success and continuously refine their approach based on insights gained from the analytics tools themselves.
How can I ensure a smooth implementation of analytics solutions?
To ensure a smooth implementation of analytics solutions, start by clearly defining your business objectives and the specific insights you aim to derive from the data. Utilize GoodData's robust APIs and SDKs, including React, Python, and JS, to facilitate integration with your existing systems. Establish role-based access controls to manage permissions effectively and ensure data security. Leverage GoodData's multi-tenant architecture to scale your analytics while maintaining data isolation for different users or clients. Additionally, adopt best practices in software development, such as CI/CD for deployment and testing, to streamline the process. Finally, consider utilizing the self-service insights and dashboards offered by GoodData to empower your team and enhance collaboration throughout the implementation phase.
What insights can I gain from customer usage analytics?
Customer usage analytics provides valuable insights into how customers interact with your products or services, enabling businesses to make data-driven decisions. By analyzing metrics such as feature usage, session duration, and user engagement, companies can identify which features are most popular and which may need improvement. This information helps in understanding customer preferences and behaviors, allowing for more personalized experiences and targeted marketing strategies. Additionally, usage analytics can reveal patterns that indicate potential churn, enabling proactive measures to retain customers. Ultimately, leveraging these insights can enhance customer satisfaction, optimize product offerings, and drive overall business growth.
How does fraud detection analytics save costs for insurance companies?
Fraud detection analytics saves costs for insurance companies by leveraging advanced data analysis and statistical modeling to identify and prevent fraudulent claims before they are paid out. By analyzing extensive data sets, these analytics can uncover patterns and anomalies that indicate potential fraud, allowing insurers to take proactive measures. This not only reduces the financial losses associated with fraudulent claims but also streamlines the claims process, enhancing operational efficiency. Additionally, by improving the accuracy of underwriting decisions through better risk assessment, insurance companies can minimize their exposure to fraudulent activities. Overall, implementing fraud detection analytics leads to significant cost savings and improved profitability for insurance firms, making it a crucial investment in their operational strategy.
What are the benefits of using omnichannel analytics for customer engagement?
Omnichannel analytics provides significant benefits for enhancing customer engagement by offering a comprehensive view of customer interactions across various channels. This approach allows businesses to track and analyze customer behavior, preferences, and engagement patterns in real-time, enabling them to create personalized experiences that resonate with their audience. By integrating data from multiple touchpoints, such as social media, email, and in-store interactions, companies can identify trends and optimize their marketing strategies accordingly. Additionally, omnichannel analytics helps in measuring the effectiveness of campaigns and understanding customer journeys, which can lead to improved retention rates and increased customer loyalty. Ultimately, leveraging omnichannel analytics empowers businesses to make data-driven decisions that enhance customer satisfaction and drive growth.
How can I measure the success of my analytics initiatives?
To measure the success of your analytics initiatives, start by defining clear, specific goals aligned with your business objectives. Utilize analytics tools like Google Analytics or GoodData to track key performance indicators (KPIs) such as traffic, conversion rates, and user engagement metrics. Establish a unified view of your data across different marketing channels to avoid switching between apps, allowing for a comprehensive analysis of performance. Configure alerts to monitor progress against your defined targets and thresholds, enabling timely adjustments to your strategies. Regularly review and analyze the data to identify trends and insights that can inform future initiatives, ensuring that your analytics efforts contribute to improved decision-making and enhanced ROI.
Looker vs GoodData Analytics: Which is better for data visualization?
When comparing Looker and GoodData Analytics for data visualization, both platforms offer unique strengths tailored to different business needs. Looker excels with its semantic modeling layer (LookML), which ensures data governance and consistency, making it ideal for organizations that prioritize trusted data for AI models and natural language querying. Its enhanced visualization capabilities allow for intuitive storytelling and collaboration. On the other hand, GoodData Analytics provides robust features like role-based access controls, a no-code UI, and seamless integration with tools like ClickHouse, making it suitable for businesses seeking flexible, self-service analytics. Ultimately, the choice between Looker and GoodData Analytics depends on your specific requirements for data governance, ease of use, and integration capabilities.
GoodData Analytics vs Power BI: What are the key differences?
GoodData Analytics and Power BI are both powerful business intelligence tools, but they cater to different needs and use cases. GoodData Analytics is designed for embedded analytics, allowing businesses to integrate rich data visualizations and self-service BI directly into their applications, making it ideal for companies looking to provide analytics to their customers. It emphasizes data governance and multi-tenancy, which is beneficial for organizations managing multiple clients. In contrast, Power BI is known for its user-friendly interface and strong data visualization capabilities, making it suitable for internal reporting and analysis. While Power BI excels in ad-hoc reporting and ease of use, GoodData offers more robust options for customization and embedding analytics into third-party platforms, making it a better choice for businesses focused on delivering analytics as a service.
How does GoodData Analytics compare to Qlik?
GoodData Analytics and Qlik are both powerful business intelligence (BI) tools, but they cater to different needs and use cases. GoodData Analytics excels in providing embedded analytics and self-service BI, allowing users to create customized dashboards and visualizations with ease. Its architecture supports multi-tenancy, making it ideal for organizations that need to manage analytics across various clients or departments. In contrast, Qlik is known for its associative data model, which enables users to explore data freely and uncover insights without predefined queries. While Qlik offers strong data discovery capabilities, GoodData focuses on delivering a seamless integration experience and robust automation features. Ultimately, the choice between GoodData and Qlik depends on your specific requirements for analytics, customization, and user experience.
Domo vs GoodData Analytics: Which tool offers better analytics features?
When comparing Domo and GoodData Analytics, both tools offer robust analytics features, but they cater to different business needs. Domo excels in providing a user-friendly interface with extensive data visualization capabilities and real-time data integration, making it ideal for organizations that prioritize ease of use and quick insights. On the other hand, GoodData Analytics focuses on embedded analytics and offers strong customization options, allowing businesses to integrate analytics seamlessly into their applications. GoodData also emphasizes self-service BI, enabling users to create their own dashboards and insights without heavy reliance on IT. Ultimately, the choice between Domo and GoodData Analytics depends on whether your organization values user-friendly visualizations or the ability to embed and customize analytics within existing platforms.
GoodData Analytics vs Sisense: Which platform is more user-friendly?
When comparing GoodData Analytics and Sisense in terms of user-friendliness, both platforms offer distinct advantages. GoodData is designed with a focus on self-service capabilities, allowing users to create customizable dashboards and reports with minimal technical expertise, thanks to its low-code and no-code options. This makes it accessible for users across various skill levels. On the other hand, Sisense is known for its intuitive interface and powerful data visualization tools, which can be particularly appealing for users who prioritize visual analytics. However, Sisense may require a steeper learning curve for advanced features. Ultimately, the choice between GoodData and Sisense will depend on your specific needs, such as the level of customization required and the technical proficiency of your team.
What are the unique strengths of GoodData Analytics compared to Sisense?
GoodData Analytics and Sisense both offer robust business intelligence solutions, but they have unique strengths that cater to different enterprise needs. GoodData Analytics is particularly known for its intelligent semantic layer, which ensures that data behind AI-generated insights is consistent and reliable, fostering trust among users. Its API-first, headless BI architecture allows for extensive customization and integration, making it ideal for embedding analytics into applications. Additionally, GoodData's non-user based licensing model can lead to greater ROI for organizations. In contrast, Sisense excels in its ability to handle large datasets and offers powerful data visualization capabilities, making it suitable for organizations that prioritize complex data analysis. Ultimately, the choice between GoodData and Sisense depends on specific business requirements, such as the need for trust and extensibility versus advanced data handling and visualization.
Why should I switch from GoodData Analytics to Power BI?
Switching from GoodData Analytics to Power BI can be beneficial depending on your specific business needs and preferences. Power BI offers a user-friendly interface and robust integration with Microsoft products, making it an excellent choice for organizations already embedded in the Microsoft ecosystem. It provides extensive data visualization options and advanced analytics capabilities, which can enhance reporting and insights. On the other hand, GoodData Analytics excels in embedded analytics and self-service BI, allowing for rich customization and seamless integration into existing platforms. Additionally, GoodData's API-first architecture and non-user based licensing can lead to a greater ROI for some businesses. Ultimately, the decision should be based on your organization's requirements for data integration, visualization capabilities, and overall analytics strategy.
What are the best alternatives to GoodData Analytics?
When considering alternatives to GoodData Analytics, several notable options stand out. Tableau is a popular choice known for its robust data visualization capabilities and user-friendly interface, making it ideal for businesses that prioritize visual storytelling. Power BI, developed by Microsoft, offers seamless integration with other Microsoft products and is favored for its affordability and extensive features. Qlik is another strong contender, providing powerful associative data modeling and analytics capabilities. Domo focuses on real-time data visualization and collaboration, making it suitable for teams needing immediate insights. Lastly, Sisense is recognized for its ability to handle large datasets and provide advanced analytics. Each of these alternatives has unique strengths, so the best choice depends on your specific business needs and existing tech stack.
GoodData Analytics vs Tableau: Which is more cost-effective?
When comparing GoodData Analytics and Tableau in terms of cost-effectiveness, it's essential to consider their pricing structures and the value they provide. GoodData offers flexible and scalable pricing plans, allowing businesses to choose options based on their specific analytics needs, including a 30-day free trial to evaluate the platform. In contrast, Tableau typically has a higher upfront cost with licensing fees that can add up, especially for larger teams. While Tableau is renowned for its powerful visualization capabilities, GoodData's embedded analytics and self-service BI features may provide better value for organizations looking to integrate analytics seamlessly into their platforms. Ultimately, the choice between the two will depend on your organization's specific requirements, budget, and the importance of features like customization and scalability.
How does GoodData Analytics integrate with Snowflake compared to other tools?
GoodData Analytics integrates with Snowflake through an optimized direct-query platform that enhances performance by allowing real-time analytics without the need for data movement, effectively eliminating data silos. This integration enables users to execute queries directly on Snowflake data, providing consistent analytics results and facilitating the development of data-driven revenue streams. Compared to other tools, such as ClickHouse or Redshift, GoodData's API-first architecture offers a more seamless experience for embedding analytics and managing data access with role-based controls. While other platforms may require more complex data transfers or lack the same level of real-time capabilities, GoodData’s integration with Snowflake is designed to maximize efficiency and scalability, making it a compelling choice for organizations looking to leverage their data effectively.
GoodData Analytics vs Metabase: Which offers better data visualization options?
When comparing GoodData Analytics and Metabase for data visualization options, both platforms offer unique strengths. GoodData Analytics provides a robust suite of customizable data visualizations with a drag-and-drop interface, allowing users to easily modify metrics, dimensions, and visualization types. It also supports dynamic dashboards that enable deeper data exploration and self-service BI capabilities for brand partners. In contrast, Metabase is known for its user-friendly interface and simplicity, making it accessible for non-technical users to create visualizations quickly. However, it may lack some of the advanced customization features and enterprise-level capabilities that GoodData offers, such as multi-tenant workspace isolation and extensive API support. Ultimately, the choice between GoodData and Metabase will depend on your specific business needs, technical requirements, and the level of customization desired in your data visualizations.
What makes GoodData Analytics a better choice than Qlik?
GoodData Analytics stands out as a better choice than Qlik for several reasons, particularly for enterprises seeking trust, scalability, and extensibility. GoodData's intelligent semantic layer ensures that data behind AI-generated insights is consistent and reliable, which is crucial for informed decision-making. Additionally, GoodData offers a more flexible API-first architecture that supports low-code and no-code options, making it easier for organizations to integrate analytics into their existing platforms. While Qlik provides robust data visualization capabilities, GoodData excels in delivering self-service BI and customizable dashboards that empower users to access insights without heavy IT involvement. Furthermore, GoodData's focus on enterprise-scale automation and role-based access controls enhances security and governance, making it a compelling choice for businesses looking to modernize their analytics approach.
Is GoodData Analytics a good alternative to Domo?
GoodData Analytics and Domo are both robust business intelligence platforms, but they cater to slightly different needs. GoodData Analytics excels in providing self-service analytics, data modeling, and strong data governance, making it ideal for organizations that require centralized control over their data across multiple tenants. It also offers features like analytics-as-code, which can be beneficial for teams looking to automate and customize their analytics processes. On the other hand, Domo is known for its user-friendly interface and extensive data visualization capabilities, making it suitable for businesses that prioritize ease of use and quick insights. Ultimately, the choice between GoodData and Domo depends on your specific requirements, such as the need for advanced data governance versus a more intuitive user experience.
GoodData Analytics vs Salesforce (Tableau): Which is better for business intelligence?
When comparing GoodData Analytics and Salesforce (Tableau) for business intelligence, both platforms offer unique strengths tailored to different business needs. GoodData Analytics excels in providing embedded analytics and self-service BI capabilities, allowing users to create customized dashboards and visualizations that integrate seamlessly into existing applications. Its architecture is designed for scalability and accommodates complex analytics requirements. On the other hand, Salesforce (Tableau) is renowned for its robust data visualization tools and strong integration with Salesforce CRM, making it ideal for organizations heavily invested in the Salesforce ecosystem. Ultimately, the choice between GoodData and Tableau depends on specific business requirements, such as the need for embedded analytics versus advanced visualization capabilities, as well as existing infrastructure and user familiarity with the platforms.
What are the advantages of using GoodData Analytics over traditional BI tools?
GoodData Analytics offers several advantages over traditional BI tools, primarily through its API-first headless BI architecture and non-user based licensing, which enhances ROI and scalability for businesses of all sizes. Unlike conventional BI solutions that often rely on static dashboards, GoodData provides rich embedded analytics with customizable dashboards, allowing for a seamless integration into existing platforms. Its self-service BI capabilities empower users to access and analyze data independently, fostering a data-driven culture. Additionally, GoodData's AI-driven features facilitate faster data discovery and predictive analytics, enabling organizations to identify trends and patterns more effectively. This modern approach not only streamlines the analytics process but also ensures consistency and governance across reporting, making it a superior choice for businesses looking to modernize their analytics capabilities.
GoodData Analytics vs AWS: Which platform provides better analytics capabilities?
When comparing GoodData Analytics and AWS for analytics capabilities, it's essential to consider their distinct strengths. GoodData Analytics is a specialized platform designed for self-service analytics, offering features like real-time data querying, customizable dashboards, and embedded analytics tailored for customer applications. Its architecture is optimized for analytics, allowing users to create visualizations easily without moving data. In contrast, AWS provides a broader cloud infrastructure with various services, including data storage and processing tools like Amazon Redshift and QuickSight, which can be integrated for analytics purposes. While AWS offers flexibility and scalability for large-scale data operations, GoodData excels in delivering a focused, user-friendly analytics experience. Ultimately, the choice depends on whether you need a dedicated analytics solution or a more comprehensive cloud platform with diverse capabilities.
How does GoodData Analytics compare to Zoho in terms of features?
GoodData Analytics and Zoho Analytics both offer robust business intelligence solutions, but they cater to different needs and user experiences. GoodData is known for its powerful embedded analytics capabilities, allowing businesses to integrate analytics seamlessly into their applications with customizable dashboards and self-service BI options. It supports a code-first approach with features like Analytics as Code, which is particularly beneficial for software engineering teams. In contrast, Zoho Analytics provides a user-friendly interface with drag-and-drop functionality, making it accessible for non-technical users. While GoodData excels in scalability and enterprise-level automation with role-based controls, Zoho focuses on affordability and ease of use for small to medium-sized businesses. Ultimately, the choice between GoodData and Zoho will depend on your specific business requirements, technical capabilities, and budget considerations.
What are the reasons to choose GoodData Analytics over Alteryx?
Choosing GoodData Analytics over Alteryx can be advantageous for enterprises seeking a robust, scalable, and extensible analytics solution. GoodData's architecture is specifically designed for cloud environments, providing seamless integration with platforms like Snowflake and ClickHouse, which enhances data management and analytics capabilities. Additionally, GoodData offers an API-first headless BI architecture with non-user based licensing, allowing for greater ROI and flexibility in deployment. Its intelligent semantic layer ensures that data insights are consistent and reliable, which is crucial for decision-making. Furthermore, GoodData supports embedded analytics and self-service BI, empowering users with customizable dashboards and metrics. While Alteryx excels in data preparation and advanced analytics, GoodData's focus on enterprise-scale automation, trust, and governance makes it a compelling choice for organizations looking to modernize their analytics infrastructure.
GoodData Analytics vs IBM: Which offers superior data integration?
When comparing GoodData Analytics and IBM for data integration, both platforms offer distinct advantages. GoodData excels with its API-first headless BI architecture, allowing for seamless integration of analytics into existing workflows and systems without disruption. It supports a variety of SDKs, including React, Python, and JavaScript, and emphasizes low-code/no-code capabilities, making it accessible for users with varying technical skills. On the other hand, IBM provides robust data integration solutions, particularly in enterprise environments, with strong support for large-scale data management and advanced analytics. While GoodData focuses on self-service and customizable dashboards, IBM's offerings are often more comprehensive for complex data environments. Ultimately, the choice depends on specific business needs, such as the desired level of customization and the existing tech stack.
What differentiates GoodData Analytics from other cloud-based analytics tools?
GoodData Analytics differentiates itself from other cloud-based analytics tools through its unique architecture and comprehensive feature set designed for scalability, customization, and ease of integration. Unlike many competitors, GoodData offers a modular analytics platform that combines self-service BI, embedded analytics, and robust data governance, allowing organizations to centralize and customize their data models effectively. Its Analytics-as-Code approach empowers software engineering teams to automate and deploy insights using code, enhancing flexibility and control. Additionally, GoodData's focus on providing rich data visualizations and customizable dashboards ensures that users can derive actionable insights tailored to their specific needs. This combination of features, along with its ability to integrate seamlessly with platforms like Snowflake, positions GoodData as a powerful solution for businesses seeking to enhance their analytics capabilities.
GoodData Analytics vs Oracle: Which is more suitable for large enterprises?
When comparing GoodData Analytics and Oracle for large enterprises, both platforms offer robust capabilities but cater to different needs. GoodData Analytics is designed with an API-first, headless BI architecture that allows for seamless integration and customization, making it particularly suitable for organizations looking for flexibility and low-code/no-code solutions. It excels in delivering embedded analytics and self-service BI, which can empower users across the organization. On the other hand, Oracle provides a comprehensive suite of business intelligence tools with strong data management and governance features, ideal for enterprises that require extensive data processing and security. Ultimately, the choice depends on the specific requirements of the enterprise, such as the need for customization versus comprehensive data management capabilities.
What are the key features that set GoodData Analytics apart from its competitors?
GoodData Analytics distinguishes itself from competitors through its robust feature set designed for scalability, customization, and user empowerment. Key features include an intelligent semantic layer that ensures data consistency and reliability, enabling users to trust AI-generated insights. The platform supports multiple SDKs, including React, Python, and JavaScript, allowing for seamless integration and customization within existing applications. GoodData also offers a flexible user interface that accommodates all-code, low-code, or no-code approaches, making it accessible for users with varying technical skills. Additionally, its role-based access controls and multi-tenant workspace isolation enhance security and manageability for enterprises. With self-service BI capabilities, users can create custom metrics and dashboards, driving actionable insights and fostering data-driven decision-making across organizations.
GoodData Analytics vs SAS: Which tool is better for advanced analytics?
When comparing GoodData Analytics and SAS for advanced analytics, both tools offer unique strengths tailored to different business needs. GoodData Analytics excels in providing embedded analytics and self-service BI capabilities, allowing users to create customized dashboards and visualizations easily. Its cloud-native architecture is designed for scalability and integration with platforms like Snowflake and ClickHouse, making it suitable for organizations looking for flexibility and ease of use. On the other hand, SAS is renowned for its robust statistical analysis and predictive modeling capabilities, making it a preferred choice for organizations that require deep data insights and complex analytics. Ultimately, the choice between GoodData Analytics and SAS depends on your specific requirements, such as the need for user-friendly dashboards versus advanced statistical tools.
How does GoodData Analytics perform against Insightsoftware?
GoodData Analytics and Insightsoftware both offer robust business intelligence solutions, but they cater to different needs and use cases. GoodData Analytics excels in providing a cloud-based, API-first architecture that supports embedded analytics and self-service BI, making it ideal for organizations looking to integrate analytics seamlessly into their applications. It offers rich data visualizations, role-based access controls, and a strong focus on automation and scalability. In contrast, Insightsoftware is known for its financial reporting and operational analytics capabilities, particularly for ERP systems, which may appeal more to finance-focused teams. Ultimately, the choice between GoodData and Insightsoftware depends on your specific requirements, such as the need for embedded analytics versus financial reporting functionalities.
What are the best features of GoodData Analytics compared to other BI tools?
GoodData Analytics stands out among BI tools due to its robust features designed for data visualization and analytics. Key highlights include customizable dashboards that allow users to create tailored metrics and insights, making it easy for teams to monitor performance and make data-driven decisions. The platform supports various integration options, enabling seamless connections with multiple data sources, which enhances its versatility. Additionally, GoodData offers self-service BI capabilities, allowing users to access and filter data independently, fostering data democratization. Compared to competitors like Power BI and Qlik, GoodData's emphasis on embedded analytics and role-based access controls provides a secure and intuitive user experience, making it particularly suitable for B2B2C applications. Overall, its combination of ease of use, powerful analytics, and strong customer support makes GoodData a compelling choice for businesses seeking effective BI solutions.
GoodData Analytics vs Google Analytics: Which is more effective for data insights?
GoodData Analytics and Google Analytics serve different purposes in the realm of data insights, making their effectiveness dependent on specific business needs. GoodData Analytics is designed for advanced business intelligence, offering robust data visualization, predictive analytics, and self-service BI capabilities that allow users to create customized dashboards and reports tailored to their unique requirements. In contrast, Google Analytics primarily focuses on web traffic analysis, providing insights into user behavior on websites and apps, which is invaluable for digital marketing strategies. While Google Analytics excels in tracking and analyzing online user interactions, GoodData Analytics provides a broader scope for data integration and analysis across various business functions, making it more suitable for organizations seeking comprehensive data insights beyond just web analytics. Ultimately, the choice between the two depends on whether the focus is on web performance or a more holistic view of business data.
What are the integration capabilities of GoodData Analytics compared to others?
GoodData Analytics offers robust integration capabilities that set it apart from competitors. It supports a variety of integrations, including popular platforms like Snowflake, BigQuery, LinkedIn Ads, Slack, and ClickHouse, allowing businesses to seamlessly connect their data sources and enhance analytics workflows. In comparison, other analytics solutions may offer fewer integration options or lack the same level of customization. GoodData's API-first architecture enables developers to embed analytics directly into applications, providing a tailored user experience. Additionally, its support for both low-code and no-code environments makes it accessible for users with varying technical skills, further enhancing its integration versatility. This flexibility ensures that organizations can leverage their existing tech stack while maximizing the value of their data analytics initiatives.
GoodData Analytics vs Microsoft Power BI: Which is easier to use?
When comparing GoodData Analytics and Microsoft Power BI in terms of ease of use, both platforms offer user-friendly interfaces but cater to different needs. GoodData Analytics is designed for embedding analytics into applications, providing a seamless experience with role-based access and customizable dashboards, making it particularly suitable for organizations looking to deliver self-service insights to their users. Its drag-and-drop UI simplifies the creation of visualizations and metrics. On the other hand, Microsoft Power BI is known for its robust data visualization capabilities and integration with other Microsoft products, which can be advantageous for users already within the Microsoft ecosystem. While Power BI may have a steeper learning curve for advanced features, its extensive community support and resources can help users navigate challenges. Ultimately, the choice depends on your specific use case and existing infrastructure.
What are the limitations of GoodData Analytics compared to Qlik?
GoodData Analytics and Qlik both offer robust business intelligence solutions, but they have distinct limitations. GoodData Analytics has a character limit of 10,000 for text fields in tabular charts, which can be restrictive for users dealing with extensive regulatory documents or detailed reports. Additionally, while GoodData emphasizes self-service BI and embedded analytics, it may not provide the same level of advanced data visualization options as Qlik, which is known for its rich, interactive dashboards and associative data model. On the other hand, Qlik's pricing structure can be more complex, potentially leading to higher costs for larger teams. Ultimately, the choice between GoodData and Qlik will depend on specific business needs, such as the importance of extensive data handling versus advanced visualization capabilities.
GoodData Analytics vs Tableau Free Alternatives: Which is worth the investment?
When comparing GoodData Analytics to Tableau free alternatives, it's essential to consider the specific needs of your business. GoodData offers a robust platform with advanced analytics capabilities, including embedded analytics, self-service BI, and customizable dashboards, making it suitable for organizations looking for comprehensive data solutions. In contrast, Tableau's free alternatives may provide basic data visualization features but often lack the depth and scalability of GoodData. While free options can be appealing for startups or small projects, they may not support the same level of data complexity or integration with tools like ClickHouse. Ultimately, if your organization requires advanced analytics and the ability to scale, investing in GoodData Analytics could provide significant long-term value compared to relying solely on free alternatives.
Gooddata Analytics Competitors
Ask Wyz


Gooddata Analytics Features
- Low
- Medium
- High
| FEATURE | RATINGS AND REVIEWS |
|---|---|
| AI Powered | Read Reviews (8) |
| Analytics | Read Reviews (560) |
| Custom Reports | Read Reviews (907) |
| CAPABILITIES | RATINGS AND REVIEWS |
|---|---|
| AI Powered | Read Reviews (8) |
| Analytics | Read Reviews (560) |
| Custom Reports | Read Reviews (907) |
Gooddata Analytics Integrations
Gooddata Analytics integrates with a wide range of software applications through its robust data import and export capabilities.
Ask Wyz


Software Failure Risk Guidance
?for Gooddata Analytics
Overall Risk Meter
Top Failure Risks for Gooddata Analytics
GoodData Corporation News
ACCESS Newswire Rebrands GoodData to GoodData.AI, Signals AI?First ...
GoodData has rebranded to GoodData.AI, reflecting its shift towards AI-driven solutions. This rebranding highlights the company's focus on advanced analytics and machine learning, aiming to position itself as a leader in the AI-first market. The change is strategic, enhancing GoodData's differentiation in the analytics space and aligning with broader AI trends.
GoodData is Now GoodData.AI, Reflecting Its AI-First Direction
GoodData has rebranded to GoodData.AI, emphasizing its AI-first strategy. This rebranding aligns with its focus on AI-native analytics, enhancing capabilities like context management and agentic frameworks. The company reported significant growth in AI development and product releases, reflecting its commitment to advancing enterprise AI deployments.
GoodData joins agentic AI development mix with Agent Builder
GoodData has launched Agent Builder, a framework for developing agentic AI applications. Released on April 22, it allows users to create and scale custom agents using GoodData's semantic and context management layers. The platform supports both code-first and no-code development, offering prebuilt templates and APIs. It aims to enhance AI development by enabling context-aware, governed agents, providing a competitive pricing model with multi-tenancy.
GoodData Unveils Agent Builder to Accelerate Enterprise-Scale AI Agent ...
GoodData has launched Agent Builder, a new feature within its AI-native analytics platform, to streamline the deployment and management of AI agents at scale. This tool supports both no-code and developer-driven approaches, ensuring agents are context-aware and governed. It offers centralized management and observability, enabling enterprises to deploy production-ready agents efficiently, addressing operational challenges in AI deployment.
GoodData Corporation Profile
HQ Location
660 3rd St San Francisco, CA 94107
Employees
251-500
Social
Financials
PRIVATE
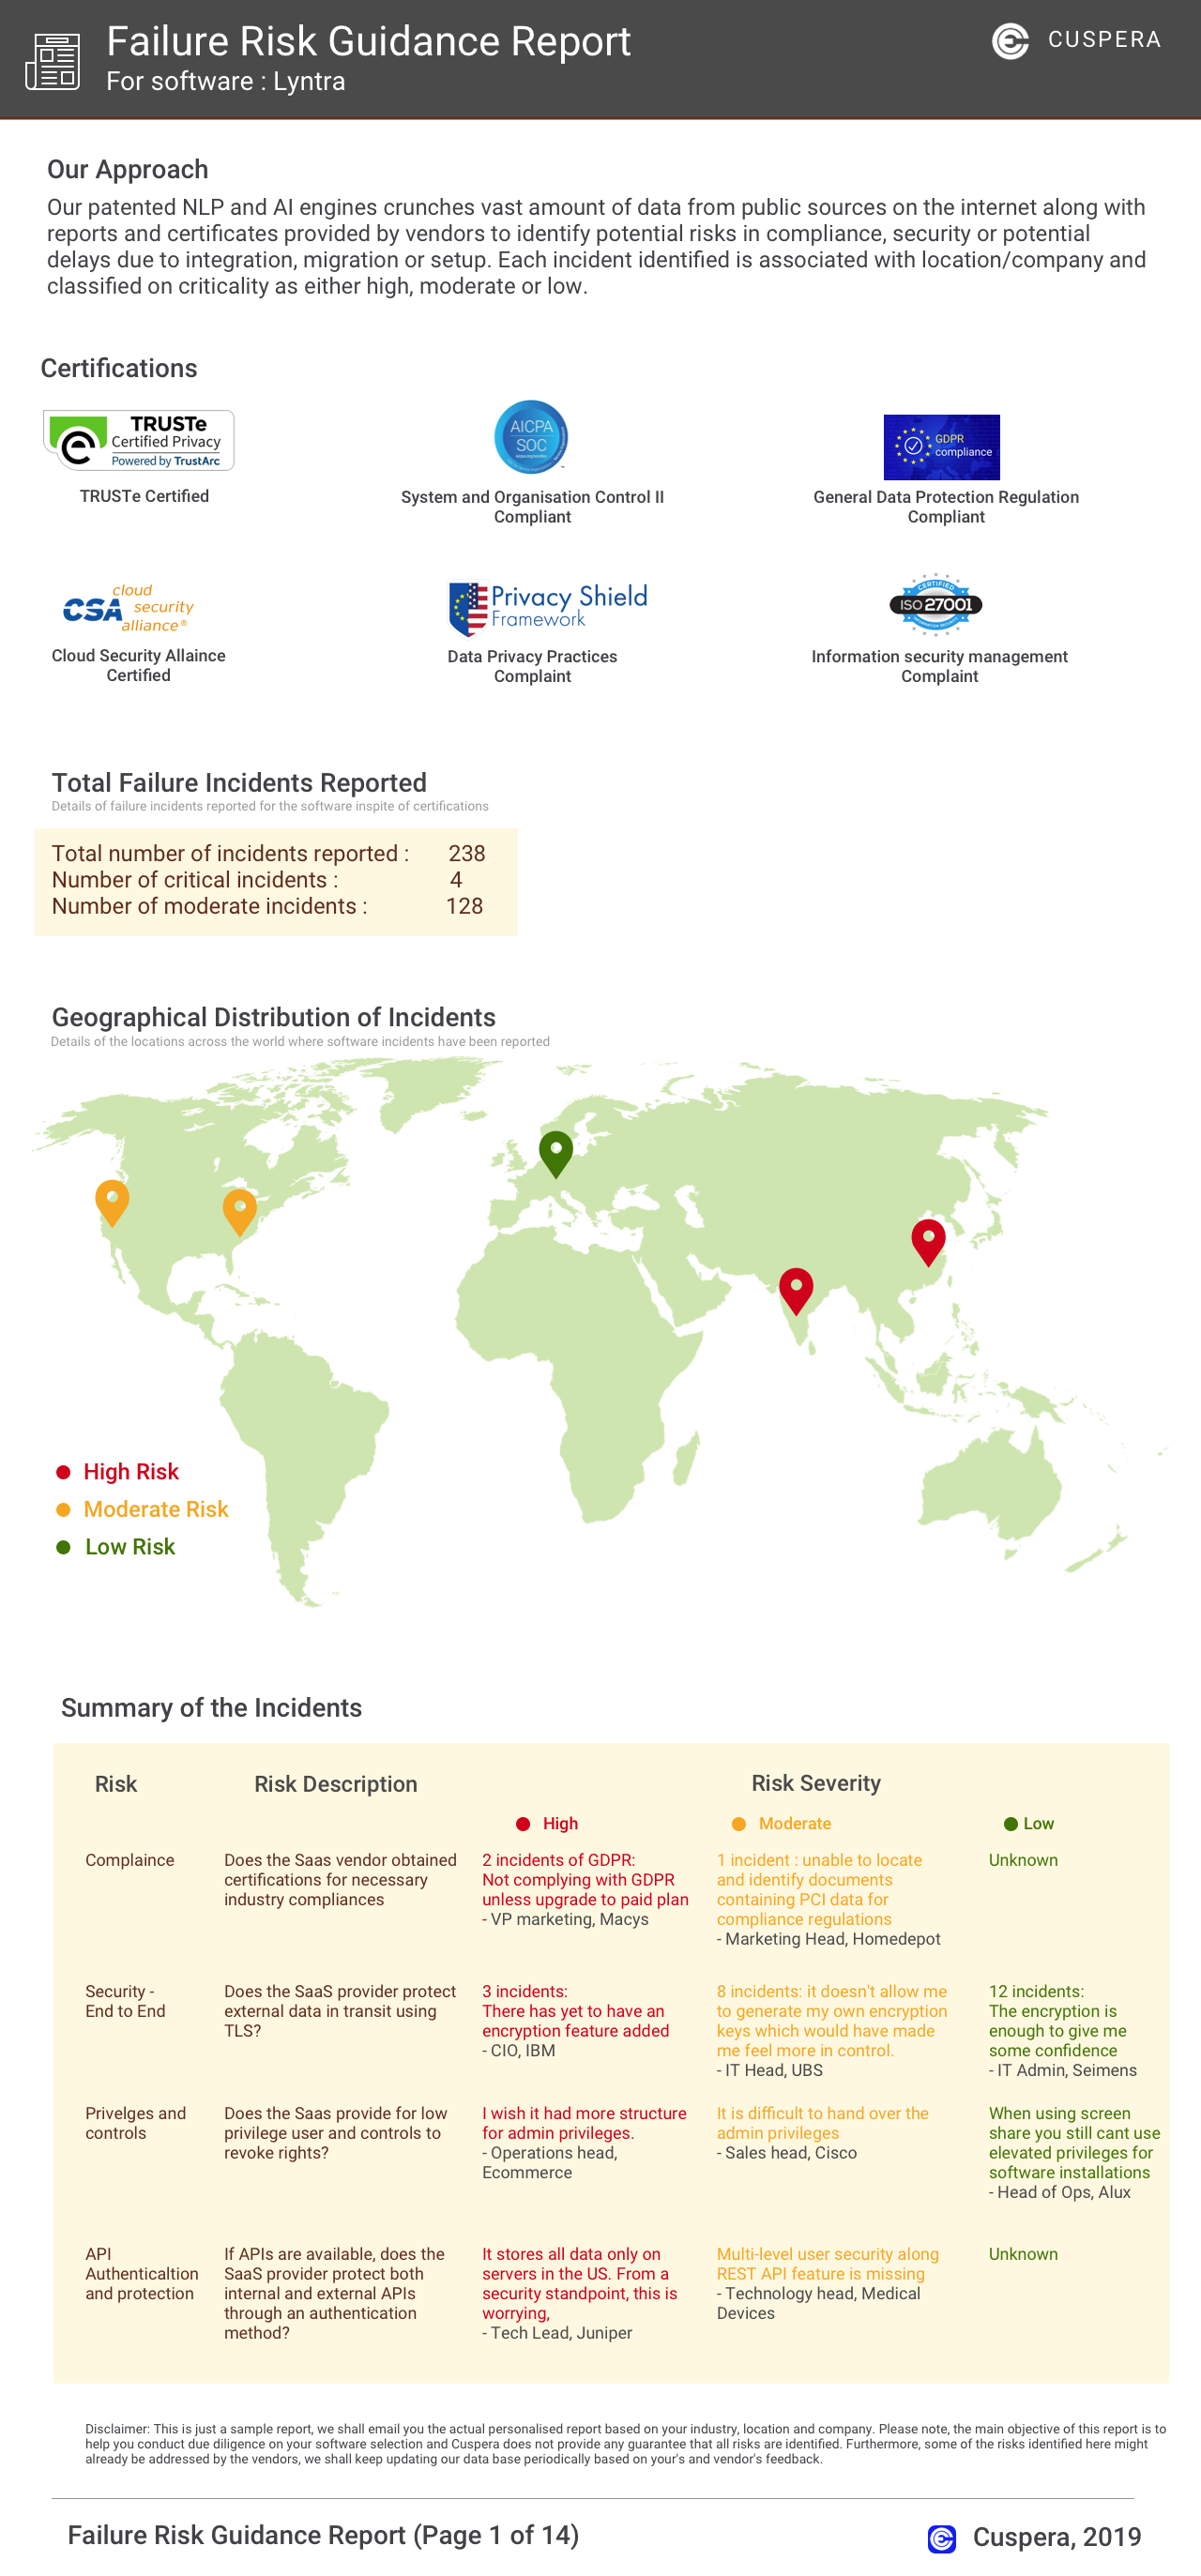
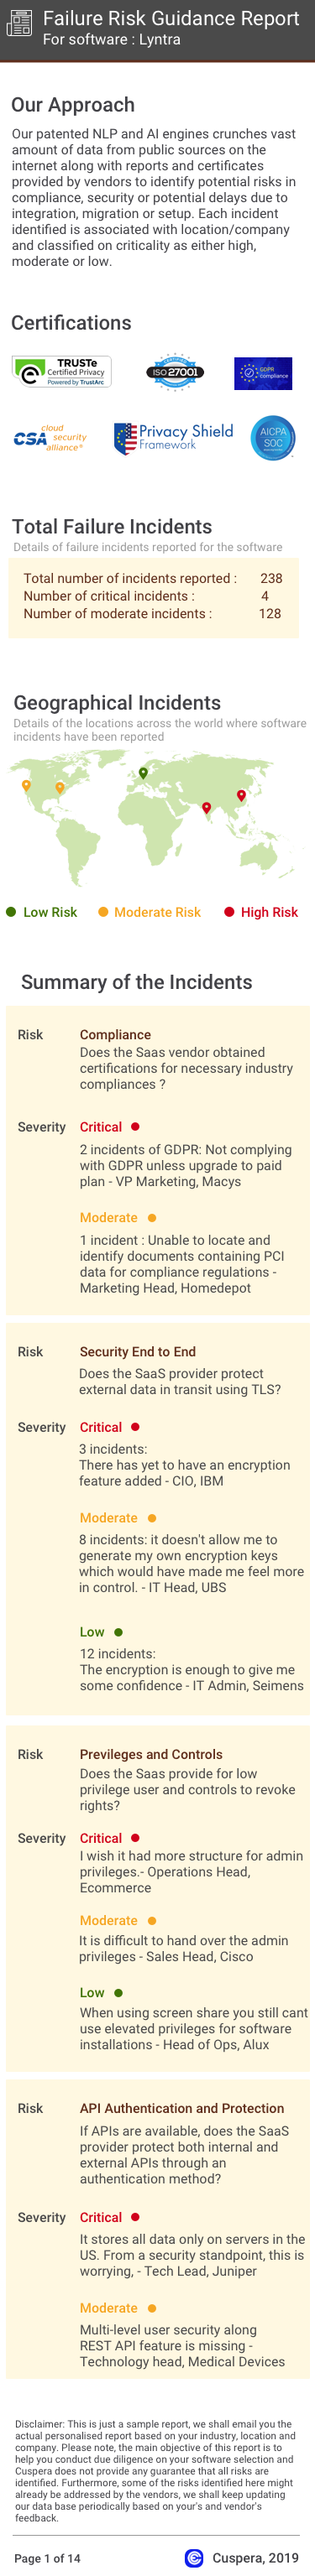
What benefits does Gooddata Analytics offer for Social Media Analytics?