

Geckoboard Overview
Geckoboard transforms how teams interact with data by offering real-time KPI dashboards. It tackles the challenge of data visibility, making crucial business metrics clear and accessible. The platform supports over 90 data sources, ensuring seamless integration of live data. This capability allows teams to stay informed and agile, responding quickly to changes. Geckoboard's dashboards are designed to be shareable, enhancing collaboration and ensuring everyone is aligned on key performance indicators. A surprising aspect is its focus on making data engaging, which helps in maintaining team motivation and focus.
Use Cases
Customers recommend Customer Feedback Management, Helpdesk Management, Competitive Intelligence, as the business use cases that they have been most satisfied with while using Geckoboard.
Business Priorities
Enhance Customer Relationships and Increase Sales & Revenue are the most popular business priorities that customers and associates have achieved using Geckoboard.
Geckoboard Use-Cases and Business Priorities: Customer Satisfaction Data
Geckoboard works with different mediums / channels such as Mass Media. and Television.
Geckoboard's features include Dashboard, Ticketing, Widgets, etc. and Geckoboard support capabilities include Chat Support, Email Support, Phone Support, etc. also Geckoboard analytics capabilities include Analytics, and Custom Reports.
Reviews
"Capture One is a powerful photo editing application. We’re based in Copenhagen, have a Support team of 14 agents and use Zendesk Support as our ticketing system. Our Geckoboard dashboard helps us keep track of whether we are reaching our targets and... to share our key support numbers to the company leaders and the rest of the organization." - Jesper Rosenkrantz
Peer review evidence (same sources as the product rating summary)
"...We have Geckoboard s set up to highlight our CSAT number as red on the dashboard in that situation...." Case Study Furlenco
"...No coding, design skills, training, extra seats for your help desk tool, or endless Googling required...." Real-time customer support dashboards
"...It's a critical component for us to keep track of our Business intelligence as well as Server Performance...." Peer review by Anonymous Reviewer, Computer Software
Geckoboard, CARTO Platform, Hevo, Phocas, Databox, etc., all belong to a category of solutions that help Business Intelligence. Each of them excels in different abilities. Therefore, determining the best platform for your business will depend on your specific needs and requirements.
Geckoboard creates real-time KPI dashboards that improve team performance. Key business data, metrics, and KPIs are made clear and easy to understand.
Popular Business Setting
for Geckoboard
Top Industries
- Information Technology and Services
- Consumer Services
- Accounting
Popular in
- Mid Market
- Small Business
- Enterprise
Geckoboard is popular in Information Technology And Services, Consumer Services, and Accounting and is widely used by Mid Market, Small Business, and Enterprise.
Geckoboard Customer wins, Customer success stories, Case studies
Why is Geckoboard the best choice for Customer Feedback Management?
How does Geckoboard facilitate Helpdesk Management?
What makes Geckoboard ideal for Competitive Intelligence?
What makes Geckoboard ideal for Onboarding?
What Are the key features of Geckoboard for Campaign Management?
| CUSTOMERS | TESTIMONIALS |
|---|---|

|
Capture One is a powerful photo editing application. We’re based in Copenhagen, have a Support team of 14 agents and use Zendesk Support as our ticketing system. Our Geckoboard dashboard helps us keep track of whether we are reaching our targets and to share our key support numbers to the company l...eaders and the rest of the organization. |

|
We’d been trading in the UK since 2011 selling pre-designed rings as well as bespoke and wanted to expand to the US, having found a big gap in the market there – 45% of ring sales are customized pieces. Testimonial By Nikolay Piriankov |
|
We were up and running within seven or eight minutes. It allows me to put the information I need at the forefront. Testimonial By Matt Bryant |
| CUSTOMERS | TESTIMONIALS |
|---|---|
|
Jesper Rosenkrantz Head of Support Capture One |
Capture One is a powerful photo editing application. We’re based in Copenhagen, have a Support team of 14 agents and use Zendesk Support as our ticketing system. Our Geckoboard dashboard helps us keep track of whether we are reaching our targets and to share our key support numbers to the company l...eaders and the rest of the organization. |
|
Nikolay Piriankov Co-Founder and CEO Taylor & Hart |
We’d been trading in the UK since 2011 selling pre-designed rings as well as bespoke and wanted to expand to the US, having found a big gap in the market there – 45% of ring sales are customized pieces. Testimonial By Nikolay Piriankov |
|
Matt Bryant Customer Service Manager COBB Tuning |
We were up and running within seven or eight minutes. It allows me to put the information I need at the forefront. Testimonial By Matt Bryant |
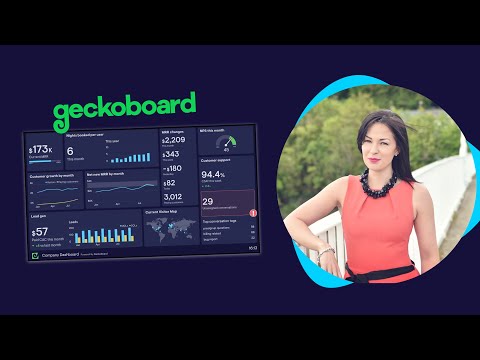
Introducing Geckoboard - Professional KPI dashboards.
Frequently Asked Questions (FAQ)
What buyers ask before choosing Geckoboard
Integrations What CRM integrations are available with Geckoboard?
Geckoboard offers a variety of CRM integrations to help users create comprehensive dashboards that visualize key metrics from their customer relationship management tools. Notably, it integrates with popular platforms such as Salesforce, HubSpot Service Hub, and Zendesk, allowing you to pull real-time data effortlessly. With these integrations, you can monitor essential KPIs related to customer interactions, sales performance, and support metrics, all in one place. Additionally, Geckoboard supports multiple accounts from these CRM systems, enabling you to consolidate data from different sources into a single dashboard. This flexibility not only enhances visibility across your organization but also empowers teams to make data-driven decisions quickly and effectively.
Integrations How does Geckoboard connect to Salesforce and what metrics can I visualize?
Geckoboard connects to Salesforce by securely linking your Salesforce account, allowing you to visualize real-time metrics from your existing Salesforce reports. To set up this connection, you simply need to choose Salesforce from the list of over 90 data sources available in Geckoboard, enter your security details, and create the connection. Once connected, you can visualize key metrics such as sales closed, opportunities created, and other performance indicators that you have already set up in Salesforce. This integration enables you to turn complex data into visually engaging dashboards that can be displayed on TVs or shared with your team, ensuring everyone stays informed about critical business performance metrics.
Integrations What data can I pull from HubSpot using Geckoboard's integration?
With Geckoboard's integration with HubSpot, you can pull a variety of real-time metrics that enhance your team's performance and decision-making. The integration focuses on both sales and ticket data, allowing you to track key metrics such as deals created, won, lost, and closed, as well as open deals and their forecasted closure times. Additionally, you can monitor ticket metrics like tickets created, closed, time to close, and time to first response. This comprehensive data access enables you to create custom dashboards that provide an up-to-date view of your HubSpot performance, ensuring that your team has instant access to the insights they need without the hassle of manual reporting.
Integrations What are the setup steps for integrating Geckoboard with Marketo?
To integrate Geckoboard with Marketo, start by logging into your Geckoboard account and navigating to the data sources page. From there, select Marketo as your data source. You will need to enter your Marketo API credentials, which include your client ID and client secret, to establish a secure connection. Once connected, you can choose the specific metrics and data you want to visualize on your dashboard. After selecting your desired metrics, use Geckoboard's drag-and-drop interface to design your dashboard layout. Finally, save your dashboard and create a sharing link to display it on screens or share it with your team. This integration allows you to monitor key marketing metrics in real-time, enhancing your team's ability to make data-driven decisions.
Integrations How does data flow between Geckoboard and Zendesk during integration?
When integrating Geckoboard with Zendesk, data flows seamlessly to provide real-time insights into various support metrics. Users securely connect their Zendesk account to Geckoboard, allowing the dashboard to access and display key performance indicators (KPIs) from Zendesk Support, Chat, Talk, QA, and Sell. This integration enables Geckoboard to pull data every few minutes, with specific refresh rates such as every 10 minutes for Support metrics, every minute for Chat metrics, and every 30 seconds for Talk metrics. As a result, teams can monitor ticket volumes, agent availability, and customer service quality in real-time, ensuring they stay responsive and informed. The integration also supports the combination of data from multiple Zendesk accounts and other tools, enhancing the overall visibility of customer support operations.
Integrations Are there any limitations to the data sync behavior between Geckoboard and my CRM?
Geckoboard offers robust integration capabilities with various CRMs, but there are some limitations to be aware of regarding data sync behavior. For instance, while Geckoboard can connect to multiple data sources, including popular CRMs like Salesforce and HubSpot, the refresh rates for data updates can vary. For example, data from Intercom updates every 5 minutes, while Excel integrations refresh every 15 minutes. Additionally, the ability to connect multiple accounts from the same CRM is supported, allowing you to aggregate metrics from different sources into a single dashboard. However, it's essential to ensure that your CRM data is publicly accessible if you're connecting databases directly. Understanding these limitations can help you effectively plan how to utilize Geckoboard for real-time insights from your CRM data.
Features What does the dashboard creator feature do in Geckoboard?
The dashboard creator feature in Geckoboard allows users to effortlessly build professional-looking dashboards in just minutes, without any coding required. This intuitive tool enables you to connect to over 90 different data sources, including spreadsheets and various databases, to pull in real-time data. Once connected, you can select the key metrics you want to monitor and utilize the drag-and-drop interface to design a customized dashboard that visually represents your data. This feature not only simplifies the process of data visualization but also enhances collaboration by allowing you to share dashboards via links, display them on TVs, or schedule email snapshots. Ultimately, the dashboard creator empowers teams to maintain a data-driven culture by providing clear insights into performance metrics.
Features How do I connect my data sources to Geckoboard?
To connect your data sources to Geckoboard, start by selecting “databases” from the data sources page on the Geckoboard platform. Choose your specific database type from the available options, ensuring that your database is publicly accessible via the internet. Next, enter the required security details to establish a secure connection, and create a name for your connection. Geckoboard supports over 90 data sources, including popular tools like Google Sheets, Google Analytics, and Salesforce, allowing you to integrate real-time data effortlessly. Once connected, you can begin building your dashboard by selecting the metrics that matter most to your business and utilizing the intuitive drag-and-drop interface to design your visualizations. This process enables you to create impactful dashboards quickly, without any coding required.
Features What types of visualizations can I create with Geckoboard's dashboard builder?
With Geckoboard's dashboard builder, you can create a variety of visualizations tailored to your specific business needs. The platform allows you to design dashboards that include key performance indicators (KPIs), charts, graphs, and other data visualizations that can represent metrics from over 90 different data sources. You can choose from bar charts, line graphs, pie charts, and more to effectively communicate your data insights. This flexibility enables you to monitor high-level metrics across multiple stores or focus on specific aspects of your operations, such as product performance. By utilizing Geckoboard's drag-and-drop interface, you can easily customize these visualizations to ensure they are not only informative but also visually appealing, helping your team and stakeholders stay aligned with your business goals.
Features How do I share read-only dashboards with my team using Geckoboard?
To share read-only dashboards with your team using Geckoboard, first, create your dashboard by connecting your data sources and designing it with the drag-and-drop interface. Once your dashboard is ready, generate a shareable link that allows your teammates, managers, or clients to view the dashboard without the ability to edit it. You can easily share this link via email, instant messaging, or by embedding it in other tools like Notion or Microsoft Teams. Additionally, you can schedule automatic email snapshots of the dashboard to keep everyone updated on key metrics. This functionality helps foster a data-driven culture within your organization by ensuring that all stakeholders have access to the most current information.
Features What features does Geckoboard offer for customizing my KPI dashboards?
Geckoboard offers a range of features that allow you to customize your KPI dashboards to meet your specific business needs. With its intuitive drag-and-drop interface, you can easily select and arrange the metrics that matter most to you, creating a professional-looking dashboard in minutes without any coding required. Geckoboard supports over 90 data sources, including popular platforms like Google Analytics, Salesforce, and HubSpot, enabling you to integrate diverse data points seamlessly. Additionally, you can tailor the appearance of your dashboard by incorporating your brand colors and logo for a personalized touch. Once your dashboard is set up, you can share it via a link, display it on TVs, or schedule automated snapshots to be sent through email or messaging platforms like Slack and Microsoft Teams, ensuring your team always has access to real-time insights.
Features How can I filter metrics in my Geckoboard dashboard?
To filter metrics in your Geckoboard dashboard, start by selecting the specific data source you want to work with, such as Google Analytics or HubSpot. Once you've connected your data, you can choose the metrics you wish to display. Geckoboard allows you to apply filters based on various criteria, such as time periods (e.g., Today, Last 7 Days) or custom properties if you have them set up in your data source. For example, in HubSpot, you can filter ticket or deal data by pipeline, status, or owner. After setting your filters, the dashboard will automatically update to reflect the selected metrics, providing a tailored view that meets your monitoring needs. This functionality enhances your ability to track performance and make informed decisions based on real-time data.
ROI & pricing What measurable business outcomes can I expect from using Geckoboard?
Using Geckoboard can lead to several measurable business outcomes that enhance decision-making and team performance. By providing real-time visibility into key performance indicators (KPIs), such as revenue, customer support metrics, and operational efficiency, teams can respond quickly to changes and trends. This immediate access to data fosters a culture of accountability and transparency, enabling stakeholders to make informed decisions based on current information. Additionally, the ability to automate reporting and share dashboards across platforms like Slack and Microsoft Teams ensures that everyone stays aligned with business goals. Companies using Geckoboard often report improved team engagement, faster response times to issues, and a clearer understanding of their performance metrics, ultimately driving better business results.
ROI & pricing How does Geckoboard help in tracking ROI for my business?
Geckoboard helps track ROI for your business by providing a user-friendly platform to create real-time dashboards that visualize key performance indicators (KPIs) relevant to your revenue and expenses. By connecting to over 90 data sources, including Google Analytics and Shopify, you can easily pull in data that reflects your financial performance. The drag-and-drop interface allows you to customize dashboards to focus on metrics that matter most, such as sales conversions, customer acquisition costs, and overall profitability. Additionally, Geckoboard enables you to share these insights with your team through TV displays or scheduled snapshots via email and collaboration tools like Slack and Microsoft Teams. This visibility ensures that all stakeholders are aligned on performance, facilitating informed decision-making that can enhance your ROI tracking efforts.
ROI & pricing What are the different pricing plans available for Geckoboard?
Geckoboard offers a variety of pricing plans to accommodate different team needs, starting with a free 14-day trial that requires no payment details. After the trial, plans begin at $60 per month, which includes options for additional dashboards, users, and TVs. The pricing structure is designed to cater to teams of all sizes, with Pro and Enterprise plans providing enhanced features such as priority support and dedicated support representatives. These plans are ideal for larger organizations that require more insight and control over their dashboards. For specific pricing details and to explore the various options available, you can view the pricing page on the Geckoboard website.
ROI & pricing How can Geckoboard contribute to cost savings for my organization?
Geckoboard can contribute to cost savings for your organization by streamlining the way you monitor and visualize key performance indicators (KPIs) across various departments. By providing real-time dashboards that aggregate data from over 90 sources, including Google Sheets and Excel, Geckoboard eliminates the need for manual reporting and reduces the time spent on data analysis. This efficiency allows teams to make quicker, data-driven decisions, ultimately leading to improved operational performance and reduced overhead costs. Additionally, the ability to share read-only dashboards with stakeholders ensures that everyone has access to up-to-date information without the risk of data manipulation, further enhancing productivity and accountability. By simplifying data visualization and reporting, Geckoboard helps organizations focus resources on strategic initiatives rather than administrative tasks, leading to significant cost savings.
ROI & pricing What is the total cost of ownership for using Geckoboard over time?
The total cost of ownership for using Geckoboard over time includes several factors. Initially, you can start with a free 14-day trial, allowing you to explore the platform without any payment details required. After the trial, plans begin at $60 per month, which can increase based on the number of dashboards, users, and TVs you need. Additionally, if you opt for Pro or Enterprise plans, you may incur higher monthly fees but gain access to enhanced support features, such as priority assistance and dedicated support representatives. It's important to consider any potential costs associated with integrating Geckoboard with other tools, such as Excel or Google Sheets, as well as the value of the insights gained from real-time data monitoring, which can lead to improved decision-making and operational efficiency over time.
ROI & pricing How quickly can I see value from implementing Geckoboard in my team?
You can see value from implementing Geckoboard in your team almost immediately, as the platform allows you to create dashboards in just minutes without any coding required. By connecting to over 90 data sources, you can quickly pull in real-time metrics that matter most to your team. The intuitive drag-and-drop interface makes it easy to design professional-looking dashboards tailored to your specific needs. Once set up, you can share these dashboards via links, display them on TVs, or schedule automated snapshots for email and messaging platforms like Slack and Microsoft Teams. This rapid deployment and accessibility ensure that your team can start making data-driven decisions right away, enhancing visibility and collaboration across your organization.
Capabilities What metrics can I visualize using Geckoboard?
With Geckoboard, you can visualize a wide range of metrics from over 90 data sources, making it a versatile tool for tracking performance across various business functions. For instance, you can monitor key Google Analytics metrics such as sessions, users, page views, and conversions, as well as Google Ads metrics like CPC, CTR, and conversion rates. Additionally, Geckoboard supports Instagram Business metrics, allowing you to track followers, post reach, and engagement. You can also create dashboards for specific needs, such as eCommerce performance metrics from Shopify or customer support metrics from Zendesk. This flexibility enables you to tailor your dashboards to display the most relevant data for your team or stakeholders, ensuring you have a comprehensive view of your business performance at a glance.
Capabilities Can Geckoboard connect to my existing CRM and ticketing software?
Yes, Geckoboard can connect to your existing CRM and ticketing software, making it a versatile tool for visualizing your key metrics. It supports over 90 data sources, including popular platforms like Zendesk, HubSpot Service Hub, Freshdesk, and Help Scout. By integrating these tools, you can create real-time dashboards that combine customer service metrics with data from other sources, such as Jira, to provide a comprehensive view of your operations. This capability allows you to monitor KPIs effectively, ensuring that your team stays informed and can respond promptly to changes. With Geckoboard's no-code setup, you can easily connect your software and start building dashboards that enhance your team's performance and decision-making.
Capabilities Does Geckoboard support real-time data updates for dashboards?
Yes, Geckoboard supports real-time data updates for dashboards, allowing users to monitor metrics as they happen. The platform connects to over 90 data sources, including popular tools like Intercom, Google Sheets, and Excel, with varying refresh rates. For instance, Intercom widgets update every 5 minutes, while Excel widgets refresh every 15 minutes. This capability ensures that you and your team can access the most current data, making it easier to make informed decisions quickly. Additionally, you can create read-only dashboards that stakeholders can view in real-time, enhancing transparency and collaboration across your organization. Overall, Geckoboard's real-time data updates significantly improve the effectiveness of your monitoring and reporting processes.
Capabilities Can I share read-only dashboards with my team using Geckoboard?
Yes, you can share read-only dashboards with your team using Geckoboard. The platform allows you to generate sharing links for your live dashboards, which can be accessed by teammates, managers, clients, or your entire organization without requiring them to create a Geckoboard account. This feature is particularly useful for keeping stakeholders informed with up-to-date metrics, as they can view the dashboards in any web browser. Additionally, you can display these dashboards on TVs or large screens around your workspace, enhancing visibility and fostering a data-driven culture. Whether you are using data from Google Sheets, Excel, or other sources, Geckoboard makes it easy to share important KPIs and insights effectively.
Capabilities Is Geckoboard capable of handling large-scale data from multiple sources?
Yes, Geckoboard is fully capable of handling large-scale data from multiple sources, making it an ideal solution for businesses that need to monitor diverse metrics in real-time. With the ability to connect to over 90 popular business tools, including Google Sheets, Shopify, MySQL, and Jira, users can aggregate data from various platforms into a single dashboard. This flexibility allows teams to create comprehensive views of their performance metrics, whether for an entire department or specific projects. Additionally, Geckoboard supports the integration of multiple accounts from the same source, enabling users to consolidate and visualize data effectively. This capability not only enhances reporting accuracy but also fosters a data-driven culture within organizations by making key performance indicators easily accessible and shareable.
Capabilities Does Geckoboard provide security features like Single Sign On (SSO)?
Yes, Geckoboard provides security features, including Single Sign-On (SSO), which allows organizations to onboard their entire team efficiently while managing access to their Geckoboard account. This feature enhances security by enabling users to log in using their existing credentials from other platforms, reducing the need for multiple passwords and improving user management. Additionally, Geckoboard ensures that sensitive data is protected by requiring that any connected databases be publicly accessible via the internet, which is a crucial consideration for maintaining data security. By implementing SSO, organizations can streamline access for their employees while ensuring that their dashboards and data remain secure, making it an ideal solution for businesses looking to enhance both usability and security.
Use cases How can SDRs use Geckoboard to track their sales opportunities in real-time?
Sales Development Representatives (SDRs) can leverage Geckoboard to track their sales opportunities in real-time by creating customized dashboards that visualize key metrics from their CRM systems, such as HubSpot. To get started, SDRs should connect their data sources, selecting relevant metrics like the value of prospective deals and their progression through the sales funnel. Using Geckoboard's intuitive drag-and-drop interface, they can design dashboards that highlight performance indicators, making it easy to monitor individual and team progress. Additionally, SDRs can automate reporting by scheduling snapshots of their dashboards to be sent to stakeholders via email or Slack, ensuring everyone stays informed. By displaying these dashboards on TVs or large screens in the office, SDRs can foster a competitive environment and keep the team focused on their sales goals.
Use cases What are the best practices for marketers to visualize campaign performance using Geckoboard?
To effectively visualize campaign performance using Geckoboard, marketers should follow several best practices. First, connect to relevant data sources such as ActiveCampaign or Google Sheets to ensure real-time data access. Next, select key metrics that align with campaign goals, such as open rates, click-through rates, and conversion rates, and utilize Geckoboard's drag-and-drop interface to design a clear and engaging dashboard. It's essential to keep the design simple and intuitive, allowing stakeholders to grasp insights at a glance. Additionally, leverage sharing features to display dashboards on TVs in the office or share links via email, Microsoft Teams, or Slack, fostering team awareness and collaboration. Regularly review and adjust the dashboard based on feedback and evolving campaign objectives to maintain its relevance and effectiveness.
Use cases In what scenarios should RevOps teams implement Geckoboard for monitoring sales metrics?
RevOps teams should implement Geckoboard for monitoring sales metrics in scenarios where real-time visibility into performance is crucial for decision-making and strategy adjustments. For instance, when tracking sales opportunities, Geckoboard allows teams to visualize the progression of deals through the sales funnel, helping identify bottlenecks and optimize processes. Additionally, if the team needs to motivate sales reps, creating competition dashboards can enhance morale and drive performance. Geckoboard's ability to connect with over 90 data sources, including CRM systems, ensures that metrics are up-to-date and relevant. Furthermore, the platform's drag-and-drop interface makes it easy to design dashboards tailored to specific goals, whether for daily reviews by sales managers or for broader visibility among stakeholders. Overall, Geckoboard empowers RevOps teams to make informed decisions based on real-time data.
Use cases How can sales leaders leverage Geckoboard dashboards to motivate their teams and boost performance?
Sales leaders can leverage Geckoboard dashboards to motivate their teams and boost performance by creating visually engaging, real-time KPI dashboards that highlight individual and team achievements. By connecting data from over 90 sources, including tools like Zendesk Sell and Google Sheets, leaders can customize dashboards to display relevant metrics that resonate with their sales teams. This transparency fosters a competitive spirit, as team members can easily track their progress against goals and see how they stack up against peers. Additionally, Geckoboard's sharing options, such as displaying dashboards on large screens or mobile devices, ensure that performance metrics are always visible, reinforcing accountability and encouraging a culture of recognition and achievement. By making performance data accessible and engaging, sales leaders can effectively drive motivation and enhance overall team productivity.
Use cases What types of dashboards can customer service teams create with Geckoboard to improve their response times?
Customer service teams can create a variety of dashboards with Geckoboard to enhance their response times and overall performance. These dashboards can visualize key performance indicators (KPIs) such as First Reply Time, ticket volume, workload, and customer satisfaction (CSAT) scores, allowing teams to monitor their efficiency in real-time. By connecting to popular customer service tools like Zendesk, HubSpot Service Hub, Freshdesk, and Help Scout, teams can aggregate data from multiple sources into a single view. This enables agents and managers to quickly identify bottlenecks, track performance trends, and make informed decisions to improve response times. Additionally, the drag-and-drop interface allows for easy customization, ensuring that the most relevant metrics are always front and center for the team.
Use cases How can teams use Geckoboard to visualize the results of A/B testing in their marketing campaigns?
Teams can use Geckoboard to visualize the results of A/B testing in their marketing campaigns by creating a dedicated A/B test dashboard that displays real-time performance metrics. To set this up, users can connect data from over 90 sources, including marketing tools, and select the specific metrics they want to track. Geckoboard's drag-and-drop interface allows for easy customization, enabling teams to design dashboards that highlight key results, such as the number of declared winners or losing variations. This visualization helps marketers quickly assess the effectiveness of different content iterations, facilitating data-driven decisions. Additionally, teams can share these dashboards via links, display them on TVs, or schedule snapshots for email and collaboration tools like Slack or Microsoft Teams, ensuring that all stakeholders stay informed about campaign performance.
Alternatives What are the best alternatives to Geckoboard for KPI dashboards?
When considering alternatives to Geckoboard for KPI dashboards, two notable options are Tableau and Klipfolio. Tableau is renowned for its powerful data visualization capabilities, allowing users to create complex and interactive dashboards from a wide range of data sources, making it ideal for in-depth analysis. Klipfolio, on the other hand, offers a user-friendly interface with real-time data integration and customizable dashboards, making it suitable for teams looking for quick insights without extensive technical expertise. Both platforms support various integrations, including Google Analytics and Salesforce, enabling seamless data connectivity. Ultimately, the choice between these alternatives will depend on your specific needs for data complexity, ease of use, and the level of customization required for effective KPI tracking.
Alternatives How does Geckoboard compare to Tableau in terms of data visualization?
Geckoboard and Tableau are both powerful tools for data visualization, but they cater to different user needs and skill levels. Geckoboard is designed for quick and easy dashboard creation, allowing users to connect to over 90 data sources and build visualizations without any coding, making it ideal for teams looking for straightforward, real-time metrics display. In contrast, Tableau offers more advanced analytics capabilities and complex visualizations, which may require a steeper learning curve and a more technical background. While Geckoboard excels in simplicity and speed for operational dashboards, Tableau is better suited for in-depth data analysis and exploration. Ultimately, the choice between the two depends on whether you prioritize ease of use and quick setup (Geckoboard) or advanced analytical features (Tableau).
Alternatives What are the key differences between Geckoboard and Domo?
Geckoboard and Domo are both powerful dashboard solutions, but they cater to different user needs and experiences. Geckoboard is designed for simplicity and ease of use, allowing users to create dashboards quickly without any coding, making it ideal for teams that need to visualize key metrics at a glance. It connects to over 90 data sources and emphasizes real-time data sharing, particularly for team environments. In contrast, Domo offers a more comprehensive business intelligence platform with advanced analytics capabilities, catering to larger organizations that require deeper data insights and extensive customization options. While Geckoboard focuses on straightforward dashboard creation and immediate visibility, Domo provides a robust suite of tools for data manipulation and in-depth reporting, making it suitable for businesses with complex data needs.
Alternatives Is Klipfolio a better choice than Geckoboard for real-time dashboards?
Klipfolio and Geckoboard both offer robust solutions for creating real-time dashboards, but they cater to slightly different needs. Klipfolio is known for its extensive customization options and advanced analytics capabilities, making it suitable for users who require in-depth data manipulation and complex visualizations. It supports a wide range of integrations and allows for detailed data modeling. On the other hand, Geckoboard excels in its user-friendly interface, enabling users to quickly set up dashboards without any coding. It focuses on simplicity and ease of use, making it ideal for teams that need to display key metrics quickly and effectively. Ultimately, the choice between Klipfolio and Geckoboard depends on your specific requirements for customization versus ease of use.
Alternatives How does Geckoboard stack up against Power BI for business intelligence?
Geckoboard and Power BI serve different purposes in the realm of business intelligence, making them suitable for varying needs. Geckoboard is a user-friendly KPI dashboard tool designed for quick setup and real-time data visualization, allowing users to create dashboards without any coding. It excels in providing a straightforward way to display key metrics on screens or share them with teams. In contrast, Power BI offers more advanced analytics capabilities, including complex data modeling and in-depth reporting features, making it ideal for users who require detailed insights and extensive data manipulation. While Geckoboard focuses on simplicity and immediate visibility of KPIs, Power BI caters to users needing comprehensive analytical tools. Ultimately, the choice between them depends on whether your priority is ease of use and quick visualization (Geckoboard) or advanced analytics and reporting (Power BI).
Alternatives What makes Databox a strong alternative to Geckoboard?
Databox is a strong alternative to Geckoboard due to its robust features that cater to data visualization and performance tracking. Like Geckoboard, Databox allows users to connect to multiple data sources, but it offers a more extensive library of pre-built templates and integrations, making it easier for users to get started quickly. Databox also emphasizes goal tracking and performance metrics, providing users with insights into their KPIs through customizable dashboards. Additionally, its mobile app allows for real-time monitoring on the go, which can be a significant advantage for teams needing immediate access to data. While Geckoboard excels in its user-friendly drag-and-drop interface, Databox's advanced analytics capabilities and extensive integration options make it a compelling choice for businesses looking for deeper insights and flexibility in their data reporting.
Geckoboard Competitors


Geckoboard Features
- Low
- Medium
- High
| FEATURE | RATINGS AND REVIEWS |
|---|---|
| AI Powered | Read Reviews (3) |
| Analytics | Read Reviews (74) |
| Custom Reports | Read Reviews (602) |
| CAPABILITIES | RATINGS AND REVIEWS |
|---|---|
| AI Powered | Read Reviews (3) |
| Analytics | Read Reviews (74) |
| Custom Reports | Read Reviews (602) |
Geckoboard Integrations
Geckoboard integrates with a wide range of software applications through its robust data import and export capabilities.


Few API Integrations for Geckoboard


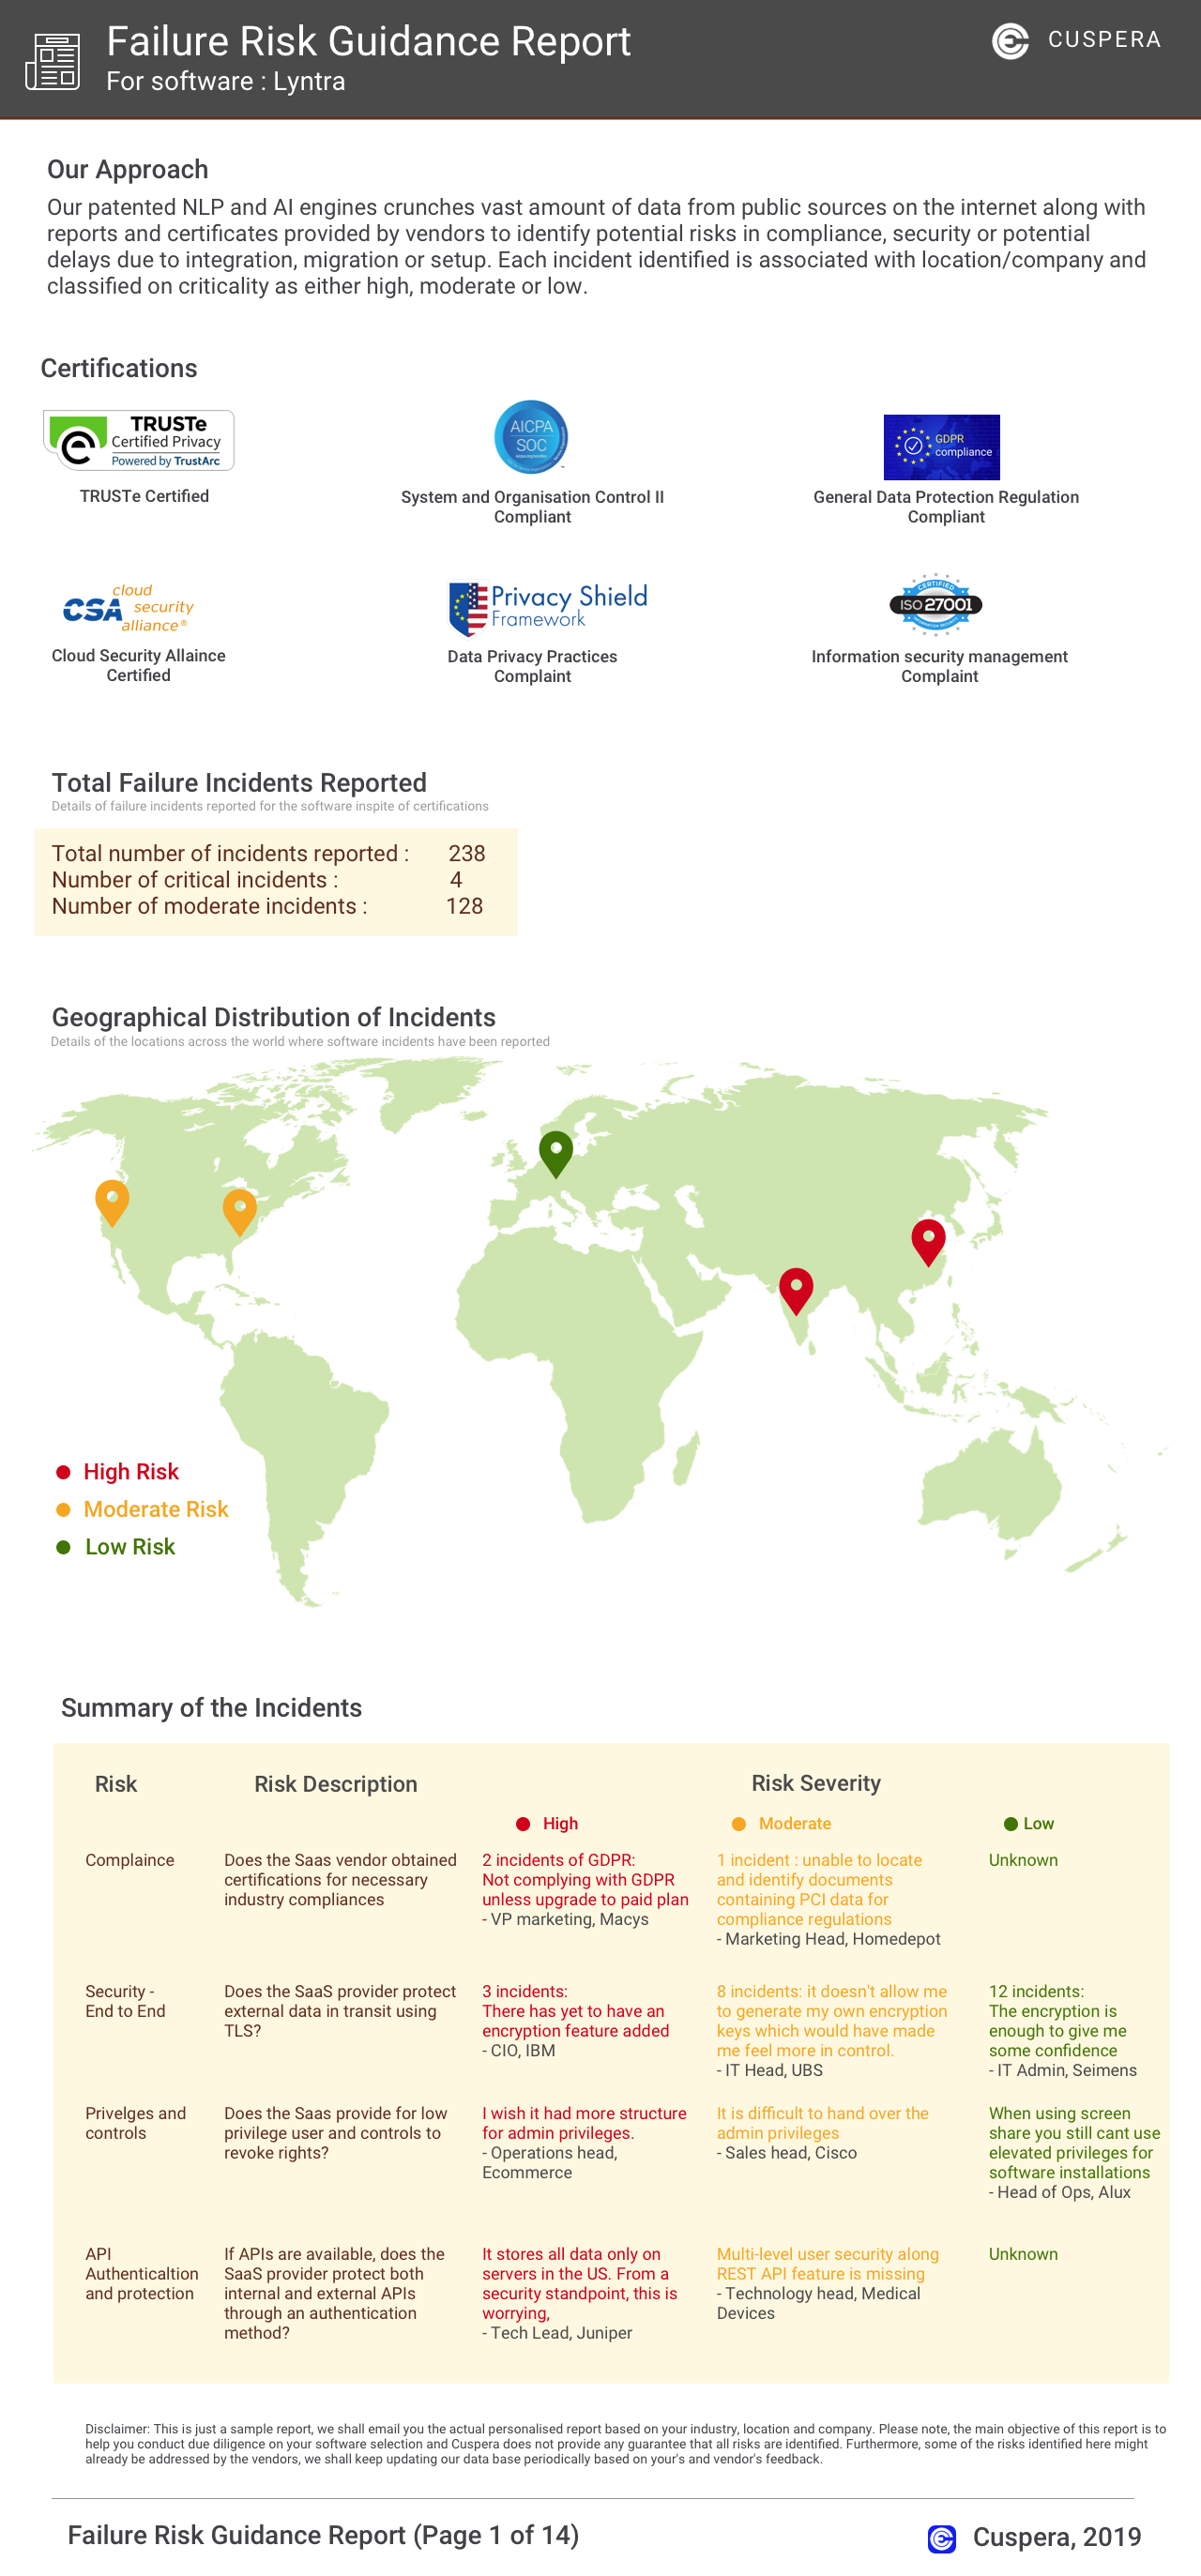
Software Failure Risk Guidance
?for Geckoboard
Overall Risk Meter
Top Failure Risks for Geckoboard
Geckoboard Ltd. News
Zendesk Voice call leg metrics now supported | Geckoboard
Geckoboard has enhanced its Zendesk Support integration by adding support for Zendesk Voice call leg metrics. This update allows users to track detailed call segments, providing insights into call patterns such as declined calls, hold times, and call quality. The new metrics include volume, duration, and quality measures, offering a comprehensive view of call activities.
Stylo and Geckoboard: bringing customer sentiment into Zendesk dashboards
Geckoboard and Stylo have partnered to integrate customer sentiment analysis into Zendesk dashboards. This collaboration allows support leaders to view emotional signals, such as frustration and urgency, alongside operational metrics in real time. The partnership aims to enhance prioritization and early intervention for customer support teams. A special offer provides three months free access to Stylo or Geckoboard for new users.
Support for custom ticket statuses in Zendesk | Geckoboard
Geckoboard has enhanced its Zendesk Support integration to include custom ticket statuses. This feature allows users to filter or split Zendesk metrics by custom statuses, such as "Awaiting Customer" or "Engineering Review," improving visibility into support workflows.
Geckoboard Ltd. Profile
HQ Location
3rd Floor, 60 Worship St, London EC2A 2EZ, UK
Employees
11-50
Social


Financials
SEED