
Overview: Blue Platform and Spark Chart as Customer Feedback Management Category solutions.
In comparing Blue Platform and Spark Chart, Blue Platform is favored among mid-sized markets and excels in educational sectors with its focus on customer satisfaction. Meanwhile, Spark Chart attracts large enterprises and covers varied industries like consulting, with a broad scope in acquiring new customers. Blue Platform's strength lies in security and privacy, while Spark Chart focuses on analytics and social media. Blue Platform offers comprehensive 24/7 support, whereas Spark Chart includes training and onboarding as a sales booster.
Blue Platform: Blue-platform enhances key employee and student experiences through survey and evaluation automation. The Blue People Insight Platform supports organizational improvement.
Spark Chart: Spark Chart offers professional survey software features to manage projects and generate detailed reports. Users can quickly become experts with its intuitive tools.
Blue Platform and Spark Chart: Best Use cases based on the customer satisfaction data


Key Capabilities Supported
Blue Platform supports diverse activities from collecting feedback and managing communications to analyzing social media interactions. These cater well to businesses focusing on comprehensive communication management. read more →
Spark Chart excels in extensive feedback collection, net promoter score analysis, and market research, making it appealing for businesses focused on analytical insights and varied communication strategies. read more →
Business Goals
Blue Platform primarily focuses on improving customer satisfaction and enhancing digital and social media presence. It's fitting for companies prioritizing engagement with audiences. read more →
Spark Chart supports multiple business goals such as improving customer satisfaction, acquiring customers, and building brand awareness. Businesses seeking diverse strategic impacts find it suitable. read more →
Core Features
Blue Platform boasts features like custom reports, security and privacy, and robust data management including import and export, catering to businesses needing detailed insights and stringent security. read more →
Spark Chart has standout features in analytics and custom reports, supporting businesses keen on training and onboarding to boost performance and insights effectively. read more →
Vendor Support
Blue Platform ensures robust support with 24/7 availability across email, phone, and chat, addressing user needs for reliable assistance. read more →
Spark Chart offers comprehensive training and onboarding, along with 24/7 support, aligning with businesses looking for structured guidance and educational resources. read more →
Segments and Industries
Blue Platform is favored by mid-market and educational users, reflecting its effectiveness in structured environments focused on comprehensive support. read more →
Spark Chart appeals to large enterprises and industries like consulting and advertising, reflecting suitability for varied and large-scale professional operations. read more →
Operational Alignment
Blue Platform integrates well with educational workflows, ensuring seamless customer feedback management for mid-sized organizations. read more →
Spark Chart fits best with large enterprise operations, supporting complex projects with a focus on analytics and social media strategies. read more →

Applying your context and needs changes the comparison
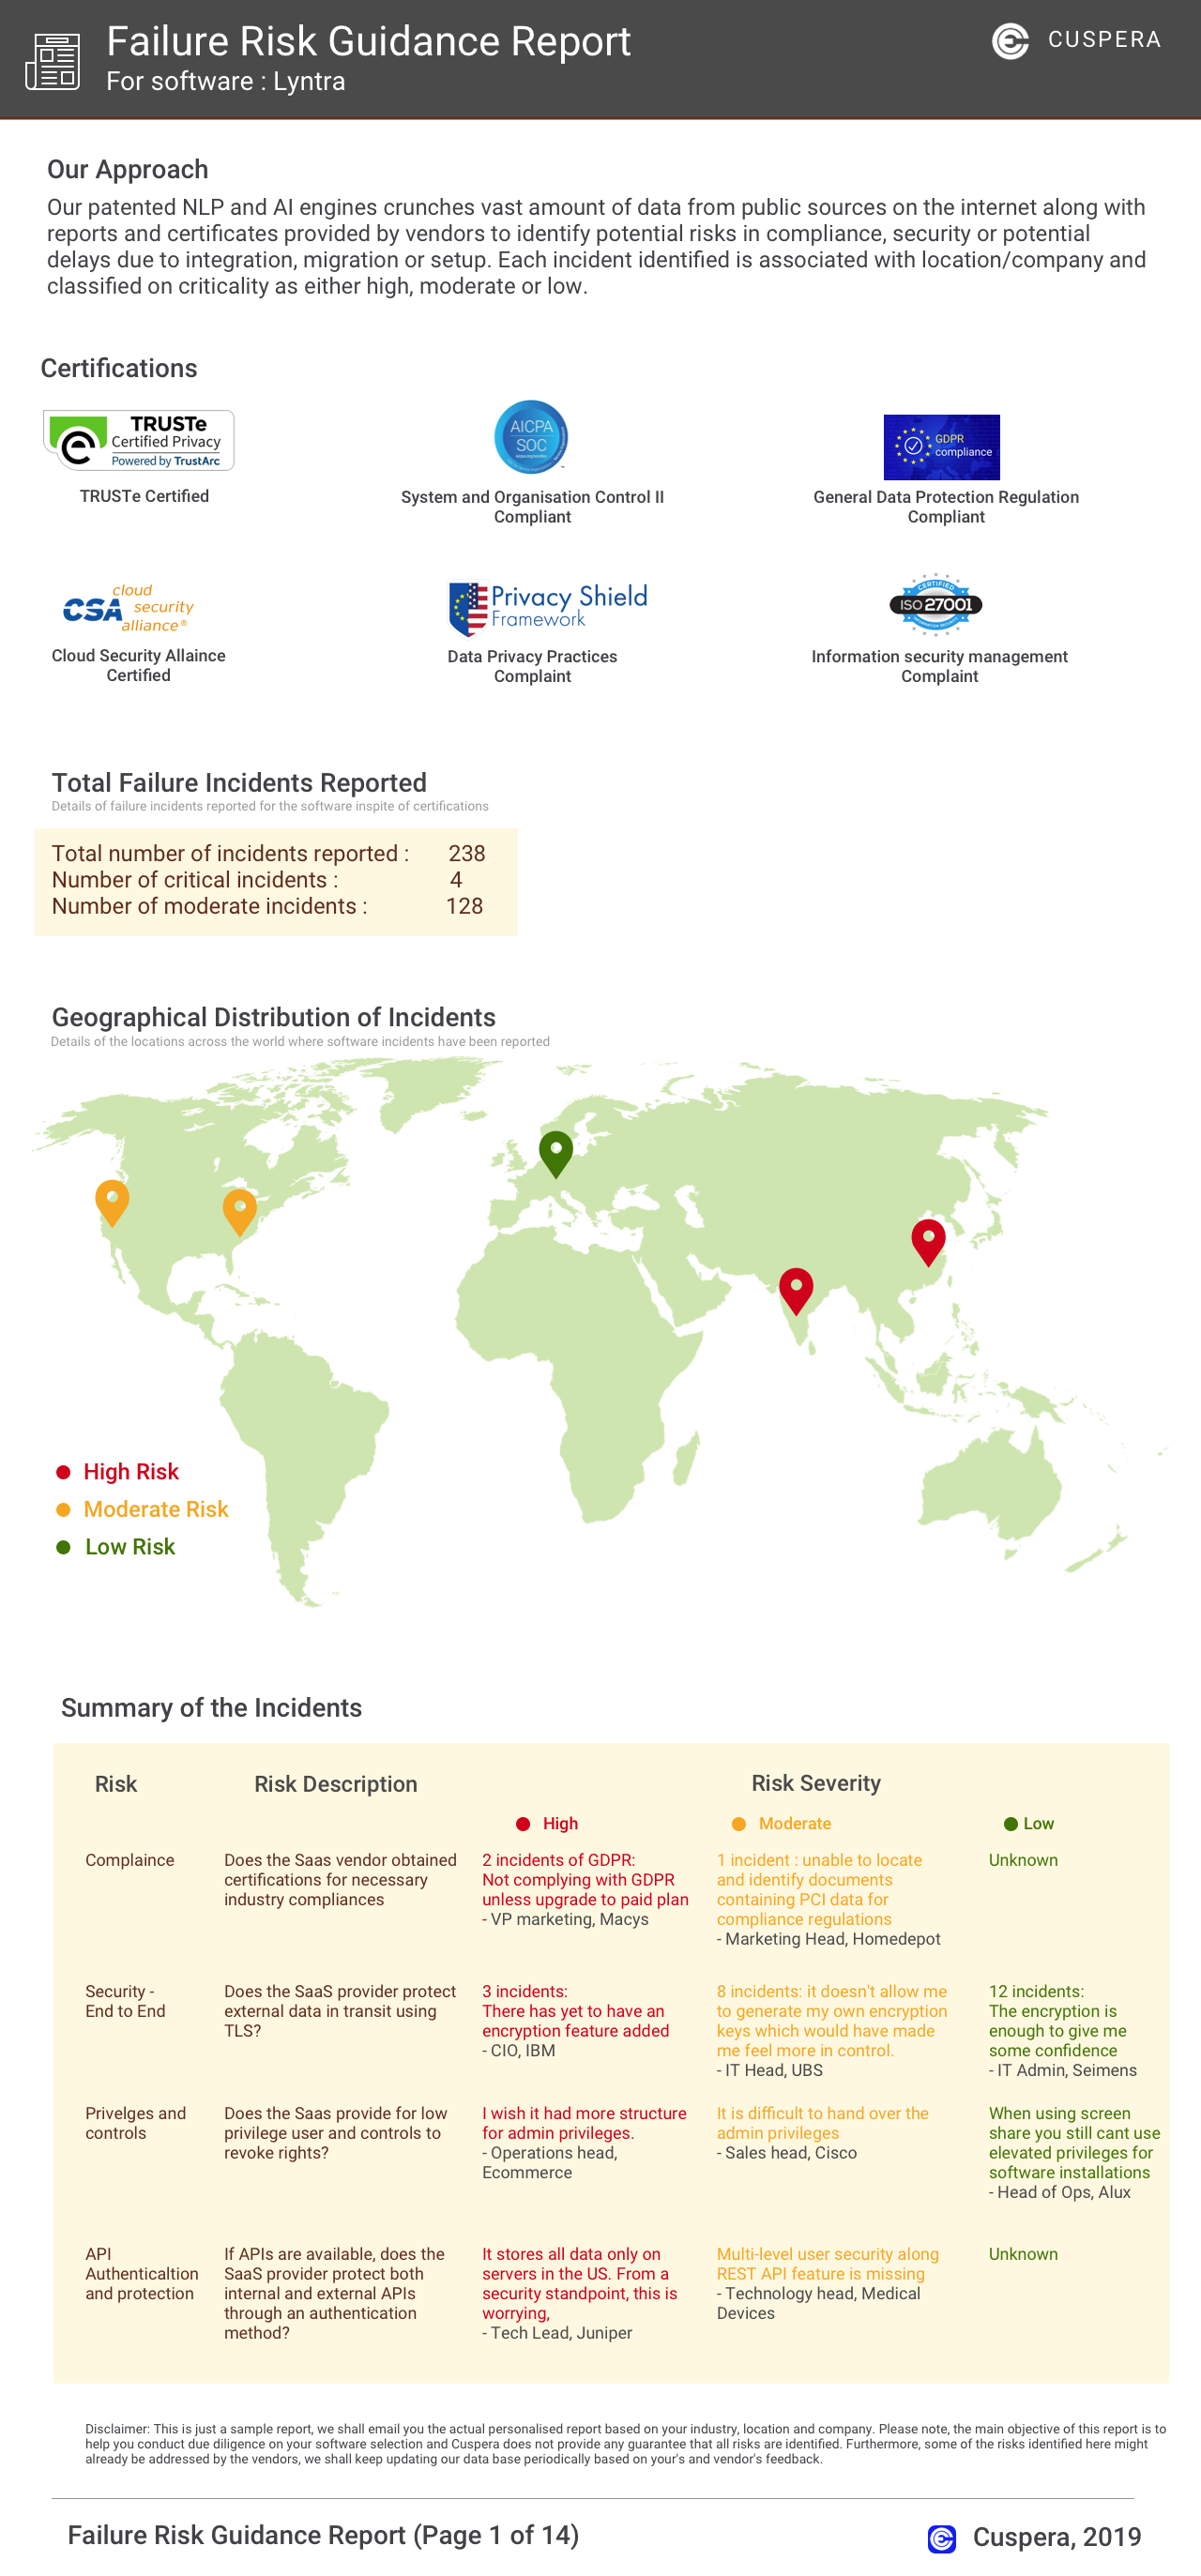
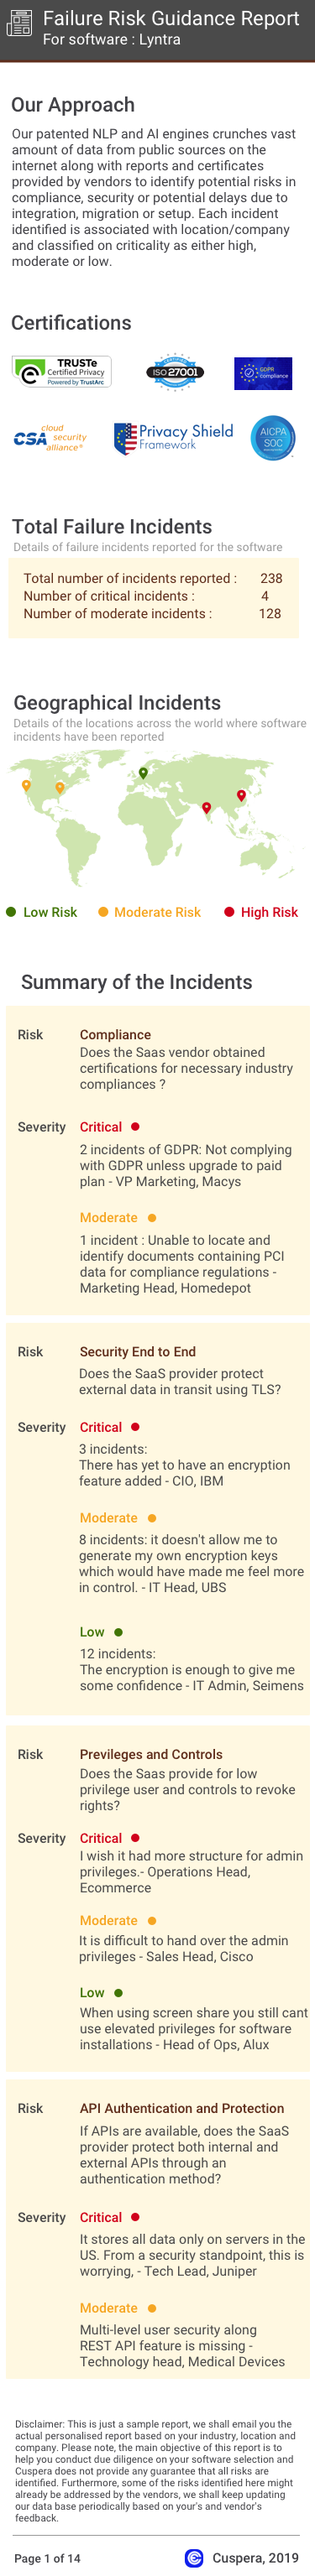
Failure Risk Guidance?
Compliance Risk
{{{rsh_C_1}}}
{{{rsh_C_1}}}
Security & Privacy Risk
{{{rsh_C_1}}}
{{{rsh_C_1}}}
Integration Risk
{{{rsh_C_1}}}
{{{rsh_C_1}}}
Migration Risk
{{{rsh_C_1}}}
{{{rsh_C_1}}}
IT and Other Capabilities
- Low
- Medium
- High
Data
Support
Others
Blue Platform in Action: Unique Use Cases
How does Blue Platform facilitate Collecting Feedback?
Spark Chart in Action: Unique Use Cases
Why is Spark Chart the best choice for Training & Onboarding?
What benefits does Spark Chart offer for Market Research?
Alternatives


News
Latest Blue Platform News
Explorance Launches BlueX 2.0: A New Era of Feedback and Expression Begins Beyond Forms, Toward Understanding
Explorance has launched BlueX 2.0, an advanced feedback platform designed to transform traditional surveys into interactive experiences. With features like a drag-and-drop builder, multimedia embedding, and real-time analytics, BlueX 2.0 supports deeper integration with systems like Salesforce and Explorance Blue. It aims to foster engagement and expression across organizations, offering unlimited users and creative formats without hidden fees. Available from June 10, 2025, it will debut at Explorance World 2025.
How efficiently Does Spark Chart manage your Social Media Management?