Overview: Fusioncharts and Hyland as Business Intelligence Category solutions.
Fusioncharts excels in data-driven operations for large enterprises, offering advanced analytics, data import/export, and comprehensive vendor support. Ideal for enterprises seeking robust integration capabilities. Alfresco BPM is a preferred choice for mid-market organizations, focusing on workflow and content management, with robust support and unique industry adaptability. Its strong vendor support and capability to enhance customer relationships make it suitable for mid-sized businesses across varied domains.
Fusioncharts: FusionCharts offers 95+ chart types, 1400+ maps, and 20+ business dashboards with pre-built themes. Trusted by over 28,000 customers and 750,000 developers, it provides responsive and customizable data visualizations.
Hyland: Alfresco Platform is an open, modern, and secure system. Process and content are intelligently activated to accelerate business flow.
Fusioncharts and Hyland: Best Use cases based on the customer satisfaction data


Key Capabilities Supported
Fusioncharts supports lead generation, competitive intelligence, and helpdesk management, aligning with operational needs of enterprises focused on data-driven improvements. read more →
Alfresco BPM excels in workflow and content management, featuring collaboration and contract management, fitting mid-market needs effectively. read more →
Business Goals
Fusioncharts facilitates increasing sales and revenue, ideal for enterprises looking to leverage data for sales growth. read more →
Alfresco BPM aids in increasing sales and enhancing customer relationships, beneficial for businesses improving visibility. read more →
Core Features
Fusioncharts highlights analytics, data import/export, and custom reports, meeting enterprise demands for detailed insights. read more →
Alfresco BPM features data import/export and integration, crucial for mid-market companies requiring extensive data management. read more →
Vendor Support
Fusioncharts provides 24/7 support, email support, and chat options, ensuring comprehensive assistance for enterprises. read more →
Alfresco BPM offers robust 24/7, email, phone, and chat support, aligning with mid-market support needs. read more →
Segments and Industries
Fusioncharts is popular among large enterprises in computer software and IT sectors, reflecting its technical capabilities. read more →
Alfresco BPM serves mid-market segments in education, government, and IT, showcasing its industry versatility. read more →
Operational Alignment
Fusioncharts is suited for enterprises needing complex data operations and secure, integrated solutions. read more →
Alfresco BPM fits mid-market environments needing robust workflows and enhanced customer engagement. read more →

Applying your context and needs changes the comparison
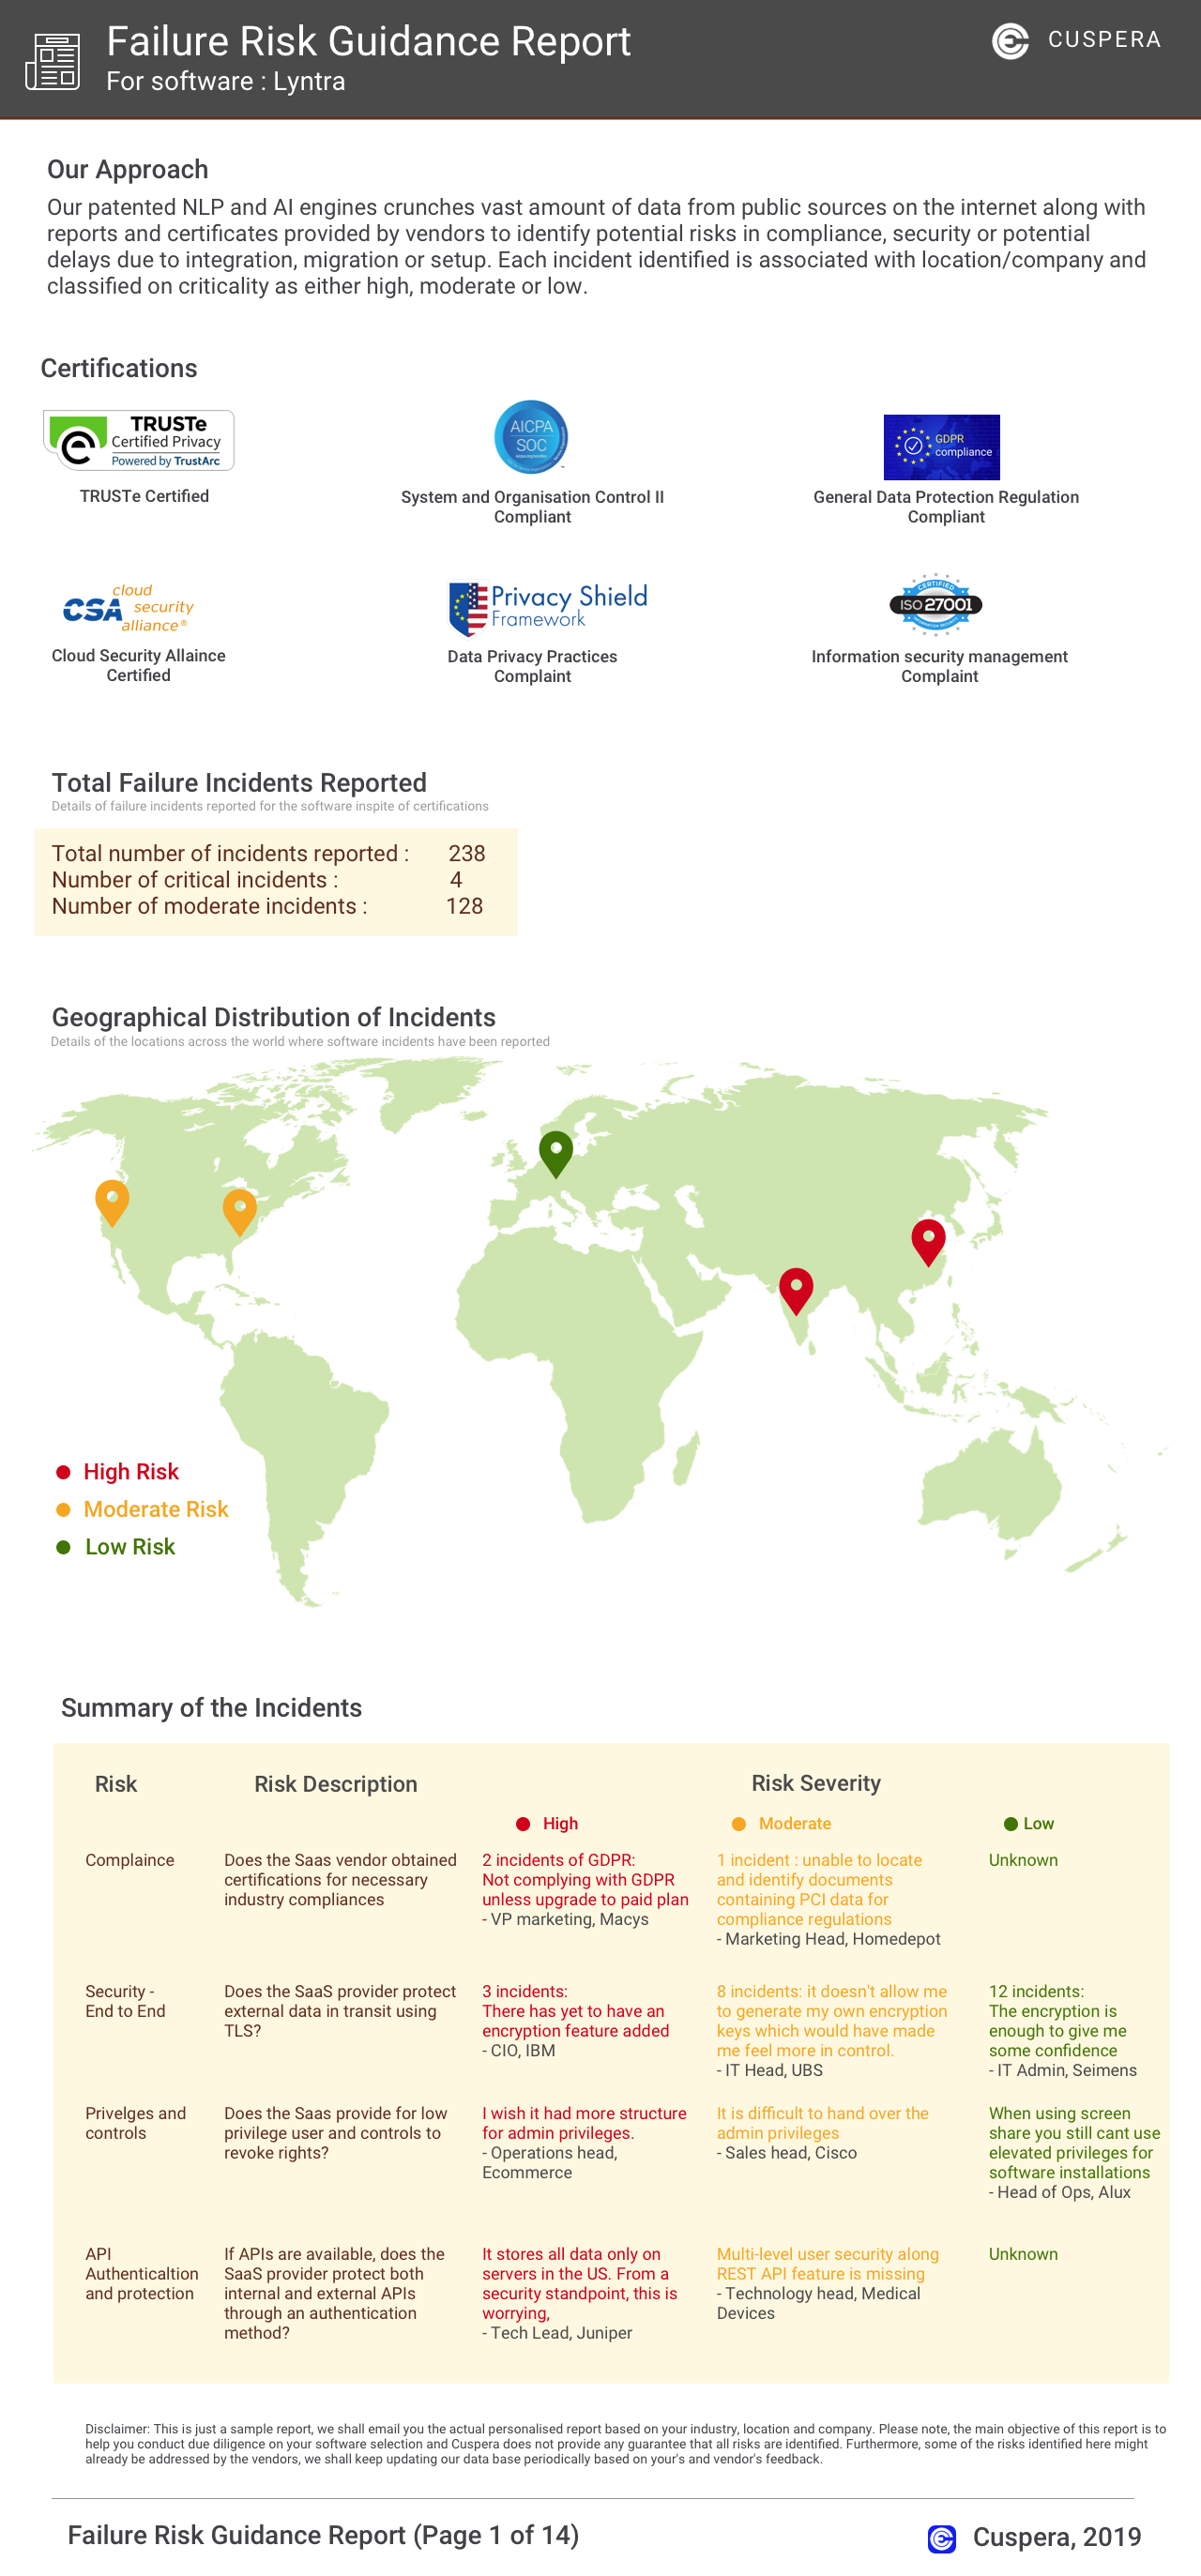
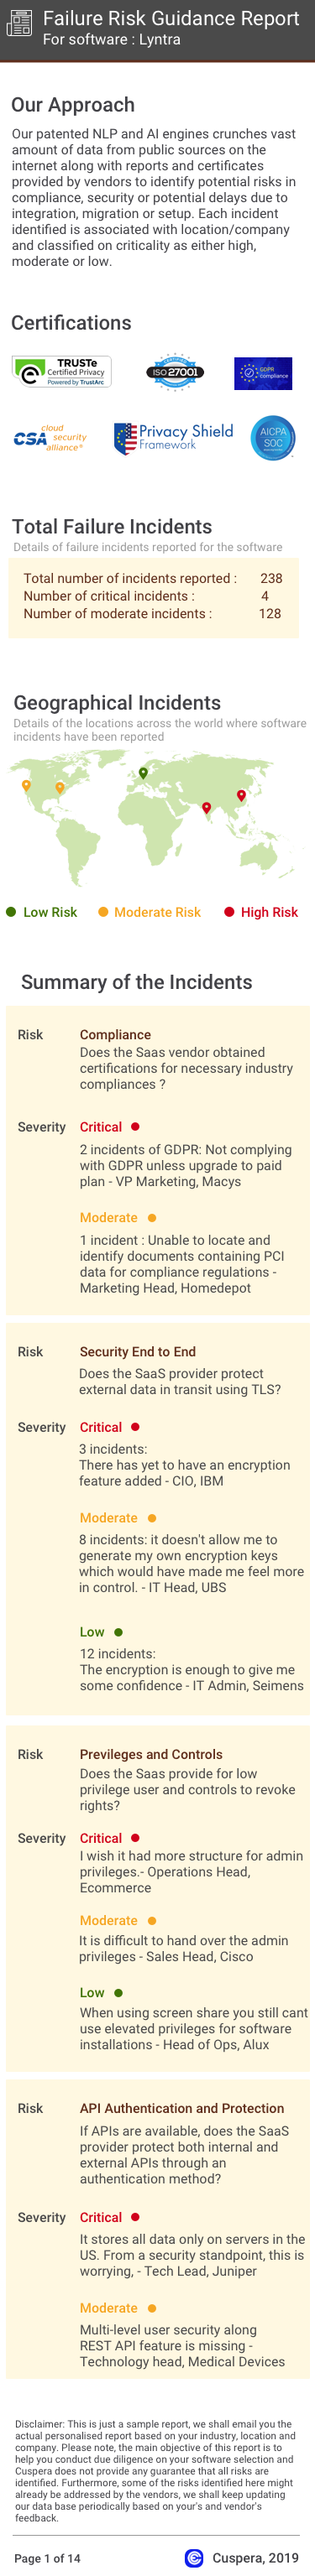
Failure Risk Guidance?
Compliance Risk
{{{rsh_C_1}}}
{{{rsh_C_1}}}
Security & Privacy Risk
{{{rsh_C_1}}}
{{{rsh_C_1}}}
Integration Risk
{{{rsh_C_1}}}
{{{rsh_C_1}}}
Migration Risk
{{{rsh_C_1}}}
{{{rsh_C_1}}}
IT and Other Capabilities
- Low
- Medium
- High
Data
Support
Others
Hyland in Action: Unique Use Cases
What solutions does Hyland provide for Workflow Management?
How does Hyland facilitate Sales Document Management?
How does Hyland address your Content Management Challenges?
Why is Hyland the best choice for Collaboration?
How does Hyland address your Helpdesk Management Challenges?
Alternatives


News
Latest Fusioncharts News
Product Release Archives - FusionBrew - The FusionCharts Blog
FusionCharts has released version 5.2.0 of its React Native Component, enhancing data visualization capabilities with over 100 interactive charts and 2,000 data-driven maps.
Latest Hyland News
Hyland and AWS bring content�powered agentic enterprise to APAC
Hyland and AWS have expanded their collaboration to bring the AI-native Content Innovation Cloud to the Asia-Pacific region. This initiative aims to support highly regulated industries by enhancing AI-driven operations with improved performance and lower latency. The partnership focuses on delivering faster digital experiences and unlocking new revenue opportunities while ensuring strong governance.