


Whatagraph Overview
Whatagraph empowers marketing teams to efficiently consolidate data from various channels and campaigns, allowing for seamless performance tracking and result reporting. This platform simplifies the process of aggregating marketing data, providing a unified view that supports informed decision-making. Agencies benefit from its ability to serve as a single source of truth, making it easier to track progress and demonstrate value to clients. A unique aspect is its ease of migration, ensuring quick onboarding and minimal disruption. By centralizing data, Whatagraph enhances the clarity and precision of marketing insights, enabling teams to focus on strategic growth.
Use Cases
Customers recommend Social Media Management, Engaging And Following Up, Advertisement, as the business use cases that they have been most satisfied with while using Whatagraph.
Business Priorities
Enhance Customer Relationships and Improve Visibility are the most popular business priorities that customers and associates have achieved using Whatagraph.
Whatagraph Use-Cases and Business Priorities: Customer Satisfaction Data
Whatagraph works with different mediums / channels such as Social Media. E-Mail. Facebook etc.
Whatagraph's features include Dashboard, Templates, and Widgets. and Whatagraph support capabilities include 24/7 Support, Chat Support, Phone Support, etc. also Whatagraph analytics capabilities include Analytics, and Custom Reports.
Reviews
"...Our automated cross-channel marketing reports answer the need of all agency workers: from data analyst to account manager to CEO...." Peer review from Whatagraph
Peer review evidence (same sources as the product rating summary)
"...It has a ton of great analytics and they email you reports that would be super valuable if you were an agency that managed social media accounts. ...." Peer review by Nate R., Ops director, Design
"...Users can automatically pull data from all of their marketing channels, create visual, engaging reports, and share them easily...." Peer review
"...LinkedIn Ads Google Sheets Simplifi HubSpot Public API Google Analytics Google Ads Facebook ..." Reporting Tool for Marketing Agencies and In-House Marketers
Whatagraph, Hevo, Reportz, DashThis, Cyfe Business Dashboard, etc., all belong to a category of solutions that help Business Intelligence. Each of them excels in different abilities. Therefore, determining the best platform for your business will depend on your specific needs and requirements.
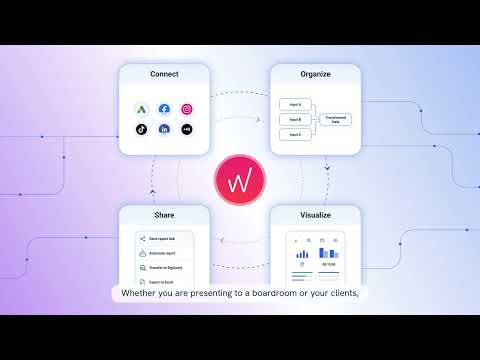
Whatagraph connects, organizes, visualizes, and shares marketing data on a single platform. It is designed for marketing agencies and in-house marketing professionals.
Popular Business Setting
for Whatagraph
Top Industries
- Marketing and Advertising
- Education
- Non-Profit Organization Management
Popular in
- Small Business
- Mid Market
- Enterprise
Whatagraph is popular in Marketing And Advertising, Education, and Non-Profit Organization Management and is widely used by Small Business, Mid Market, and Enterprise.
Whatagraph Customer wins, Customer success stories, Case studies
What Are the key features of Whatagraph for Engaging And Following Up?
What Are the key features of Whatagraph for Advertisement?
What benefits does Whatagraph offer for Channel Marketing?
What benefits does Whatagraph offer for Digital Marketing?
Whatagraph: One-Stop Marketing Data Platform
Frequently Asked Questions (FAQ)
What buyers ask before choosing Whatagraph
Integrations What CRM integrations are available with Whatagraph?
Whatagraph currently supports integrations with two major CRM platforms: HubSpot and Salesforce. These integrations allow users to seamlessly connect their marketing data with customer relationship management systems, enabling a more comprehensive view of marketing performance and customer interactions. Additionally, if your preferred CRM is not directly supported, Whatagraph offers the flexibility to connect any other CRM using a Custom API. This capability ensures that businesses can tailor their data reporting and visualization needs according to their specific CRM systems, enhancing the overall effectiveness of their marketing strategies. With these integrations, users can easily aggregate and analyze data from various sources, leading to more informed decision-making and improved marketing outcomes.
Integrations How can I connect my HubSpot account to Whatagraph?
To connect your HubSpot account to Whatagraph, you can utilize the pre-built HubSpot connector, which simplifies the integration process without the need for third-party data connectors. Start by navigating to the Data Sources menu within Whatagraph and locate HubSpot among the available channels. Click on "+Add new" in the Accounts column, then assign a name to your HubSpot account and click "Add account." You will be redirected to log in to your HubSpot account, where you can authenticate the connection. Once completed, you can seamlessly access HubSpot API data to create custom reports or dashboards, allowing you to analyze and visualize your marketing performance effectively. This integration enhances your reporting capabilities and saves time by consolidating data from multiple sources into one comprehensive view.
Integrations What are the setup steps for integrating Salesforce with Whatagraph?
To integrate Salesforce with Whatagraph, follow these straightforward setup steps: First, navigate to the Data Sources menu within Whatagraph and locate Salesforce among the available channels. Next, click on the "+Add new" option in the Accounts column. You will then need to provide a name for your Salesforce account and click "Add account." After this, you will be redirected to log in to your Salesforce account to authorize the connection. Once logged in, the integration will be complete, allowing you to seamlessly analyze and visualize your Salesforce data within Whatagraph. This pre-built connector eliminates the need for third-party data connectors, streamlining your reporting process and enhancing your marketing data management.
Integrations How does Whatagraph sync data with Google Analytics 4?
Whatagraph syncs data with Google Analytics 4 (GA4) through a fully managed integration that allows users to connect their GA4 accounts effortlessly. To initiate the sync, simply navigate to the Data Sources menu within Whatagraph, select Google Analytics 4, and click "Connect an account." After logging into your GA4 account and granting Whatagraph access, the platform automatically pulls key website analytics metrics and KPIs directly from GA4. This integration ensures that your data is consistently updated, allowing for real-time insights and reporting without the need for manual downloads or configurations. Additionally, Whatagraph enables you to blend GA4 data with other marketing sources, providing a comprehensive view of your website performance across various channels.
Integrations Are there any limitations on data flow between Whatagraph and connected platforms?
Yes, there are some limitations on data flow between Whatagraph and connected platforms, primarily depending on the specific integration and the capabilities of the source platform. While Whatagraph supports a wide range of marketing data sources, including Google Analytics, social media platforms, and CRMs like Salesforce and HubSpot, the data flow may be restricted by the API limitations of these platforms. For instance, some platforms may have rate limits on how frequently data can be pulled or may not support certain types of data extraction. Additionally, if your data source is not among the supported integrations, you can use a custom API, export data to Google Sheets, or connect via Google BigQuery, but these methods may also have their own constraints. Therefore, it's essential to review the specific integration documentation for detailed limitations.
Integrations Can I use a Custom API to connect data sources that are not natively supported by Whatagraph?
Yes, you can use a Custom API to connect data sources that are not natively supported by Whatagraph. If your data source is not listed among the over 45 digital marketing integrations available, you have the option to create a direct connection using the Custom API feature. This allows you to pull in data from virtually any source, enabling you to consolidate your reporting and analytics within Whatagraph. Additionally, if you prefer, you can also export your data to Google Sheets or Google BigQuery and then connect those as sources. This flexibility ensures that you can integrate all relevant data into your Whatagraph dashboards, enhancing your ability to analyze and visualize your marketing performance comprehensively.
Features What does the drag-and-drop dashboard builder in Whatagraph do?
The drag-and-drop dashboard builder in Whatagraph allows users to create customized marketing dashboards effortlessly by integrating data from over 40 different marketing tools. This intuitive feature enables users to select and arrange various metrics and visual elements simply by dragging and dropping them into place, making it accessible even for those without technical expertise. Users can start from scratch or choose from numerous pre-built templates, ensuring that they can tailor the dashboard to meet specific business needs. The builder not only streamlines the reporting process but also enhances the presentation of data, allowing marketing agencies and professionals to visualize cross-channel insights and key performance indicators effectively, ultimately saving time and improving decision-making.
Features How do I customize my dashboard in Whatagraph to match my client's branding?
To customize your dashboard in Whatagraph to match your client's branding, start by accessing the dashboard builder and selecting the specific dashboard you want to personalize. You can upload your client's logo and choose custom color schemes that align with their brand identity. Additionally, Whatagraph allows you to modify text styles and headers to reflect your client's messaging. To ensure a seamless experience, host the dashboard on a custom domain that features your client's name, making it feel like an integral part of their website. Once you’ve made these adjustments, you can save the dashboard as a template for future use, allowing for quick customization across multiple client dashboards. This streamlined process not only enhances your client's experience but also reinforces their brand presence.
Features What features does the AI-driven insights functionality in Whatagraph offer?
Whatagraph's AI-driven insights functionality offers a range of powerful features designed to enhance marketing reporting and analysis. Users can leverage an AI chatbot to ask specific questions about their connected data, such as identifying the best-performing campaigns. Additionally, the platform allows users to add text widgets to reports, where the AI can automatically generate summaries, highlight wins, and provide recommendations based on the data presented. This functionality not only saves time by automating the reporting process but also ensures that insights are clear and actionable, enabling marketing teams to focus on strategy rather than manual data interpretation. Overall, Whatagraph's AI features streamline the reporting workflow, making it easier for users to derive meaningful insights from complex marketing data.
Features How can I create a report using the Smart Builder in Whatagraph?
To create a report using the Smart Builder in Whatagraph, start by clicking on “New Report” and selecting “Create with IQ.” Next, choose your desired data sources, such as Google Analytics, and connect them to Whatagraph. The platform will then automatically suggest smart AI prompts based on the available data, which can include insights like SEO summaries or traffic trends. You can either select one of these suggested prompts or type your own specific request. After that, click “Generate” to create your report. Additionally, you can customize your report by adding widgets for specific KPIs, adjusting sizes, and incorporating your branding elements, ensuring that the final output is tailored to your needs and visually appealing for your audience.
Features What does the data transformation functionality in Whatagraph allow me to do?
The data transformation functionality in Whatagraph allows you to effectively organize and manipulate your data before visualizing it. This feature enables you to blend metrics and dimensions from various sources, create custom formulas, and unify or rename data outputs to ensure consistency across reports. You can aggregate data to form tiers or totals, which helps in deriving meaningful insights from complex datasets. Additionally, Whatagraph provides a dedicated space called "Organize" for these tasks, allowing you to save new metrics and formulas as templates for future use. This capability not only streamlines the reporting process but also enhances the clarity and engagement of your reports, making it easier for stakeholders to understand key performance indicators and make informed decisions.
Features How do I share live dashboard links with clients and stakeholders in Whatagraph?
Sharing live dashboard links with clients and stakeholders in Whatagraph is a straightforward process that enhances transparency and communication. To share a dashboard, first log in to your Whatagraph account and navigate to the dashboard you wish to share. Once you have the desired dashboard open, look for the option to generate a shareable link. This link can be easily copied and sent to your clients or stakeholders via email or messaging platforms. The recipients will have on-demand access to the live dashboard, allowing them to view real-time data updates without needing to log in. Additionally, you can customize the sharing settings to control access and permissions, ensuring that your clients are always informed about the latest marketing metrics and insights. This feature not only saves time but also builds trust by providing direct access to relevant data.
ROI & pricing What measurable business value can I expect from using Whatagraph?
Using Whatagraph can deliver significant measurable business value by transforming complex marketing data into clear, actionable insights. This AI-powered marketing intelligence platform enables businesses to centralize their reporting across various channels, saving time and enhancing efficiency—agencies have reported saving 3-7 hours on each report while managing over 150 clients. With automated, white-labeled reports, teams can easily monitor key performance indicators (KPIs) and make informed decisions quickly. Additionally, Whatagraph's ability to aggregate and visualize data helps businesses track marketing campaigns and product sales effectively, allowing for deeper analysis of individual team performance. Overall, Whatagraph not only streamlines reporting processes but also empowers organizations to optimize their marketing strategies and drive better results.
ROI & pricing How does Whatagraph help in calculating ROI for marketing campaigns?
Whatagraph helps in calculating ROI for marketing campaigns by centralizing all marketing data into a single platform, allowing users to track key performance indicators (KPIs) and metrics across various channels. By integrating data from sources like Google Ads, Facebook, and other marketing platforms, Whatagraph provides a comprehensive view of campaign performance. Users can create automated reports that highlight revenue generated against marketing spend, making it easier to assess the effectiveness of each campaign. The platform's AI-powered insights simplify complex data, enabling marketers to visualize their ROI clearly and make informed decisions. Additionally, Whatagraph allows for the customization of reports, ensuring that stakeholders receive relevant information tailored to their specific needs, ultimately driving better marketing strategies and improved ROI.
ROI & pricing What are the different pricing plans available for Whatagraph and what do they include?
Whatagraph offers three distinct pricing plans designed to cater to varying reporting needs: Start, Boost, and Max. The Start plan focuses on reporting basics, providing essential features for users just beginning their data journey. The Boost plan enhances capabilities with advanced performance monitoring, custom metrics, and branding options, making it suitable for growing teams. Finally, the Max plan is tailored for enterprise-level users, offering comprehensive features, including extensive integrations and advanced data organization capabilities. Each plan is structured to grow with your business, allowing for seamless upgrades as your reporting requirements evolve. For detailed information on what each plan includes and to explore pricing, you can visit the Whatagraph pricing page at https://whatagraph.com/pricing.
ROI & pricing What is the total cost of ownership when using Whatagraph for reporting?
The total cost of ownership when using Whatagraph for reporting includes the subscription fees associated with its three pricing tiers, which cater to varying needs from basic reporting to advanced performance monitoring and enterprise features. Additionally, many users have reported significant savings by eliminating the need for other costly tools, such as Supermetrics, which can cost upwards of €4,000 annually. By centralizing reporting and automating processes, Whatagraph not only reduces direct software costs but also saves time and labor, allowing teams to focus on strategic tasks rather than manual reporting. Overall, the investment in Whatagraph can lead to a more efficient reporting process and substantial cost savings, making it a valuable solution for agencies and in-house marketing teams alike. For detailed pricing information, you can visit https://whatagraph.com/pricing.
ROI & pricing How quickly can I see a return on investment after implementing Whatagraph?
The return on investment (ROI) after implementing Whatagraph can be seen relatively quickly, often within a few weeks, depending on your specific use case and the volume of data you manage. Whatagraph's AI-powered marketing intelligence platform streamlines reporting processes, allowing agencies and in-house teams to save significant time—up to 30% on report creation—by automating data collection and visualization. This efficiency not only reduces labor costs but also enhances decision-making through clearer insights, enabling faster adjustments to marketing strategies. Additionally, the ability to centralize reporting across multiple channels means that you can quickly demonstrate the impact of your marketing efforts to clients or stakeholders, further solidifying the value of your investment in Whatagraph.
ROI & pricing What cost savings have other businesses experienced by switching to Whatagraph?
Many businesses have reported significant cost savings after switching to Whatagraph for their reporting needs. For instance, one firm noted they eliminated annual expenses of €3,000 to €4,000 previously spent on Supermetrics, highlighting the financial efficiency of Whatagraph. Additionally, companies like Market Solutions have saved 30% of their time on report creation while managing over 150 clients, which translates to substantial labor cost reductions. The time saved on reporting has allowed firms to onboard new clients, further enhancing revenue potential. Overall, businesses have found that Whatagraph not only streamlines reporting processes but also contributes to a more cost-effective operation, making it a valuable investment for agencies and in-house marketing teams alike.
Capabilities What can Whatagraph do for marketing analytics?
Whatagraph is an AI-powered marketing intelligence platform designed to simplify marketing analytics by transforming complex data into clear, actionable insights. It allows marketers to connect various data sources, including Google Analytics, social media platforms, and CRMs like HubSpot and Salesforce, enabling a comprehensive view of marketing performance. With Whatagraph, users can create stunning, automated reports that are delivered on a scheduled basis, eliminating manual work and saving time. The platform's powerful data visualization tools help agencies and in-house teams present their marketing results effectively, making it easier to track campaign performance and individual team metrics. Overall, Whatagraph enhances decision-making by providing a single source of truth for all marketing data, ensuring that stakeholders have access to valuable insights at their fingertips.
Capabilities Can Whatagraph automate reporting for multiple data sources?
Yes, Whatagraph can automate reporting for multiple data sources, making it an efficient solution for agencies and brands. By connecting various marketing data sources such as Google Analytics, social media platforms like Instagram and LinkedIn, PPC tools like Google Ads and Facebook Ads, and CRMs like HubSpot and Salesforce, Whatagraph allows users to create comprehensive reports that pull data from all these platforms seamlessly. Once the data sources are connected, users can schedule automated reports to be delivered daily, weekly, or monthly, eliminating the need for manual updates. This capability not only saves time but also ensures that stakeholders have access to accurate and up-to-date information, allowing for better decision-making based on a unified view of marketing performance across different channels.
Capabilities Does Whatagraph support real-time data refresh for reporting?
Yes, Whatagraph supports real-time data refresh for reporting, ensuring that your metrics are always accurate and up to date. The platform automatically refreshes data every 30 minutes, allowing you to visualize key performance indicators such as funnel performance, content views, and custom events without the worry of late or inaccurate information. By utilizing the Adobe Analytics reporting API, Whatagraph pulls the right metrics seamlessly, providing a complete view of your marketing performance. This near real-time capability is particularly beneficial for agencies and brands that require timely insights to make informed decisions and optimize their marketing strategies effectively. With Whatagraph, you can trust that your reports reflect the most current data available.
Capabilities Can Whatagraph provide AI-driven insights without needing a data team?
Yes, Whatagraph can provide AI-driven insights without the need for a dedicated data team. The platform is designed to simplify the process of turning complex marketing data into clear, actionable insights, making it accessible for both agencies and in-house marketing teams. Users can connect all their marketing channels and centralize reporting effortlessly, allowing them to share impactful results without requiring technical expertise. Whatagraph's AI capabilities enable users to ask questions about their data, generate summaries, and create custom dimensions without manual work or coding. This means that even those without a strong data background can leverage powerful insights to enhance their marketing strategies and decision-making processes.
Capabilities Does Whatagraph allow for role-based access controls for user management?
Yes, Whatagraph does allow for role-based access controls for user management, enabling organizations to effectively manage user permissions and access levels. This feature is essential for agencies and teams that need to ensure that sensitive data is only accessible to authorized personnel. With role-based access, administrators can assign different roles to users, such as editors or viewers, which dictate what data and functionalities they can access within the platform. This not only enhances security but also streamlines collaboration by allowing team members to focus on their specific tasks without compromising the integrity of the overall reporting process. By implementing role-based access controls, Whatagraph helps businesses maintain compliance and safeguard their data while promoting efficient teamwork.
Capabilities Can Whatagraph integrate data from over 60 different marketing platforms?
Whatagraph currently supports native integrations with over 45 marketing data sources, allowing users to connect various platforms such as Google Analytics 4, social media channels like Facebook and Instagram, PPC platforms including Google Ads and LinkedIn Ads, as well as e-commerce solutions like Shopify and WooCommerce. While it does not natively integrate with over 60 platforms, Whatagraph offers the flexibility to connect additional data sources through a Custom API or by exporting data to Google BigQuery or Google Sheets. This capability ensures that users can aggregate and visualize data from a wide range of marketing channels, enhancing their reporting and analytics efforts.
Use cases How can SDRs use Whatagraph to improve their sales reporting efficiency?
Sales Development Representatives (SDRs) can significantly enhance their sales reporting efficiency by utilizing Whatagraph's robust features. By connecting their sales tools, SDRs can aggregate critical metrics and visualize sales performance in real-time, allowing for quicker decision-making. Whatagraph offers customizable sales performance reports and pre-made templates, enabling SDRs to create detailed reports without extensive manual effort. This automation saves valuable time, allowing SDRs to focus more on engaging with prospects rather than compiling data. Additionally, the platform's ability to centralize data from various sources, including Salesforce, ensures that SDRs have a comprehensive view of their sales activities and outcomes, ultimately leading to improved performance and better alignment with marketing efforts.
Use cases What are the best practices for marketers to create customized reports using Whatagraph?
To create customized reports using Whatagraph effectively, marketers should start by clearly defining their reporting objectives and the key performance indicators (KPIs) they want to track. Utilize Whatagraph's pre-built dashboard templates to save time, or create a custom dashboard from scratch that aligns with your specific goals. Integrate data from various sources such as Google Analytics, social media platforms, and CRMs like HubSpot and Salesforce to ensure a comprehensive view of your marketing performance. Leverage the platform's visualization features to present data in an easily digestible format, making it accessible for all stakeholders, regardless of their data literacy. Finally, set up automated reporting schedules to deliver insights consistently, allowing for timely decision-making and strategy adjustments. By following these best practices, marketers can maximize the effectiveness of their customized reports with Whatagraph.
Use cases In what scenarios should RevOps teams leverage Whatagraph for performance tracking?
RevOps teams should leverage Whatagraph for performance tracking in scenarios where they need to consolidate data from multiple sources into a single, visually appealing report. This is particularly beneficial when managing complex marketing campaigns or when tracking performance across various channels, as Whatagraph allows for seamless integration with tools like Google Analytics, Quora Ads, and other marketing platforms. Additionally, teams can utilize Whatagraph's AI capabilities to automate performance summaries, saving time and enhancing clarity in reporting. The platform's customizable dashboards enable RevOps teams to tailor reports to specific client needs, ensuring that stakeholders receive relevant insights quickly. Overall, Whatagraph is ideal for teams seeking to improve data organization, visualization, and communication of performance metrics.
Use cases How can sales leaders implement Whatagraph to standardize reporting across their teams?
Sales leaders can implement Whatagraph to standardize reporting across their teams by first integrating the platform with their existing data sources, such as CRM systems and marketing tools, to ensure all relevant data is collected in one place. Next, they can utilize Whatagraph's dashboard builder to create customized, visually appealing reports that reflect key performance indicators (KPIs) relevant to their sales objectives. By leveraging the platform's automated reporting feature, sales leaders can schedule reports to be generated and distributed regularly, ensuring that all team members receive consistent updates without manual effort. Additionally, they can take advantage of Whatagraph's white-labeling options to maintain brand consistency in reports shared with stakeholders. This streamlined approach not only saves time but also enhances clarity and alignment across the sales team, leading to more informed decision-making.
Use cases What workflows can agencies adopt with Whatagraph to manage multiple client accounts effectively?
Agencies can adopt several effective workflows with Whatagraph to manage multiple client accounts seamlessly. First, they can utilize the platform's cross-platform reporting capabilities to centralize data from various marketing channels, allowing for a comprehensive view of each client's performance. By leveraging the report automation feature, agencies can schedule and deliver customized reports to clients regularly, saving time and ensuring consistent communication. Additionally, the white-label options enable agencies to present reports under their branding, enhancing professionalism. With Whatagraph's no-code data organization feature, teams can easily categorize and manage reports for different clients without needing technical expertise. This streamlined approach not only improves efficiency but also enhances client satisfaction by providing clear, actionable insights tailored to each client's needs.
Use cases How does Whatagraph help marketing teams visualize data for better decision-making?
Whatagraph helps marketing teams visualize data for better decision-making by providing an AI-powered marketing intelligence platform that simplifies complex data into clear, actionable insights. With its ability to connect multiple marketing channels, Whatagraph centralizes reporting, allowing teams to view performance metrics from various sources in one place. Users can create customized dashboards using pre-built templates or start from scratch, ensuring that the visualizations align with their specific needs. The platform also standardizes metrics across different channels, eliminating confusion and enabling teams to make informed decisions quickly. Additionally, Whatagraph automates report generation, saving time and reducing the risk of errors, which ultimately empowers marketing teams to focus on strategy rather than data management.
Alternatives What are the key differences between Whatagraph and Swydo?
Whatagraph and Swydo are both marketing data platforms, but they differ significantly in features and capabilities. Whatagraph is an all-in-one solution that allows users to connect, organize, visualize, and share marketing data without needing additional tools. It offers customizable reports, easy report sharing, and the ability to manage reports in folders. Additionally, Whatagraph supports data transfer to Google BigQuery and allows users to export processed data as CSV or Excel files, enhancing workflow efficiency. In contrast, Swydo lacks these data transfer capabilities and does not support file exports, which may limit its functionality for some users. While Swydo excels in scheduled report deliveries and offers strong customer support, Whatagraph's comprehensive features make it a more versatile choice for those seeking a complete marketing reporting solution.
Alternatives How does Whatagraph compare to Supermetrics in terms of features?
Whatagraph and Supermetrics serve different purposes in the marketing data landscape, each with unique features. Supermetrics primarily functions as a data connector, allowing users to transfer data to external visualization tools like Looker Studio, which can lead to complexities and slower performance. In contrast, Whatagraph is an all-in-one platform that not only connects but also organizes, visualizes, and shares marketing data seamlessly. It offers features such as multi-user report editing, native visualization, automated report sharing, and scheduling, making it more user-friendly for teams. While Supermetrics supports a broader range of data destinations, Whatagraph excels in providing an intuitive interface and comprehensive reporting capabilities, making it a compelling choice for businesses looking to streamline their marketing data processes.
Alternatives Is Whatagraph a better choice than AgencyAnalytics for marketing data reporting?
Whatagraph can be considered a better choice than AgencyAnalytics for marketing data reporting depending on specific user needs. Users often praise Whatagraph for its user-friendly interface, beautiful visuals, and customizable reporting features, which make complex data easy to understand for clients. Additionally, Whatagraph offers over 45 integrations with popular marketing data sources and a no-code data organization feature, enhancing its usability. In contrast, AgencyAnalytics users have noted limitations in data organization capabilities and the inability to blend data, which can hinder reporting flexibility. Ultimately, if you prioritize ease of use, customization, and extensive integration options, Whatagraph may be the superior option for your marketing data reporting needs.
Alternatives Whatagraph vs. ReportGarden: Which platform offers better automation features?
When comparing Whatagraph and ReportGarden in terms of automation features, Whatagraph clearly stands out as the superior option. Whatagraph offers robust automation capabilities, allowing users to generate automated marketing reports that can be scheduled for delivery daily, weekly, or monthly without any manual intervention. Users can set the date range, frequency, and recipients once, and the reports will be sent automatically, streamlining the reporting process significantly. In contrast, ReportGarden lacks this level of automation, requiring more manual effort to manage reports. Additionally, Whatagraph's ability to connect various data sources and automate data transfers enhances its functionality, making it a more efficient choice for agencies and in-house teams looking to optimize their reporting workflows.
Alternatives What are the advantages of using Whatagraph over Klipfolio?
Whatagraph offers several advantages over Klipfolio, making it a compelling choice for users seeking a user-friendly marketing data platform. Firstly, Whatagraph allows for the creation of an unlimited number of reports and dashboards across all pricing plans, whereas Klipfolio limits users to a maximum of 60 dashboards. Additionally, Whatagraph is designed with non-technical users in mind, enabling quicker custom visualizations and report creation without the need for extensive technical knowledge. The platform also boasts stable integrations with a 99.95% uptime and excellent customer support, ensuring a seamless experience. Furthermore, Whatagraph simplifies data connection and sharing within a single intuitive environment, eliminating the need to switch between different spaces as required by Klipfolio. Overall, these features make Whatagraph a powerful alternative for agencies and in-house teams focused on efficient marketing performance monitoring.
Alternatives Why should I consider switching from DashThis to Whatagraph?
Switching from DashThis to Whatagraph can significantly enhance your marketing reporting capabilities due to Whatagraph's all-in-one platform that allows you to connect, organize, visualize, and share data seamlessly. Unlike DashThis, which has been noted for its limited customization options and dashboard-based pricing model, Whatagraph offers extensive customization through its Smart Builder and a variety of pre-built templates, enabling you to create tailored dashboards quickly. Additionally, Whatagraph supports a wider range of native integrations, making it easier to consolidate data from multiple sources. Users also appreciate the intuitive drag-and-drop interface, which simplifies the reporting process. Overall, Whatagraph provides a more flexible and comprehensive solution for agencies and in-house teams looking to improve their marketing data management and reporting efficiency.
Whatagraph Competitors


Whatagraph Features
- Low
- Medium
- High
| FEATURE | RATINGS AND REVIEWS |
|---|---|
| Analytics | Read Reviews (37) |
| Custom Reports | Read Reviews (231) |
| CAPABILITIES | RATINGS AND REVIEWS |
|---|---|
| Analytics | Read Reviews (37) |
| Custom Reports | Read Reviews (231) |
Whatagraph Integrations
Whatagraph integrates with a wide range of software applications through its robust data import and export capabilities.



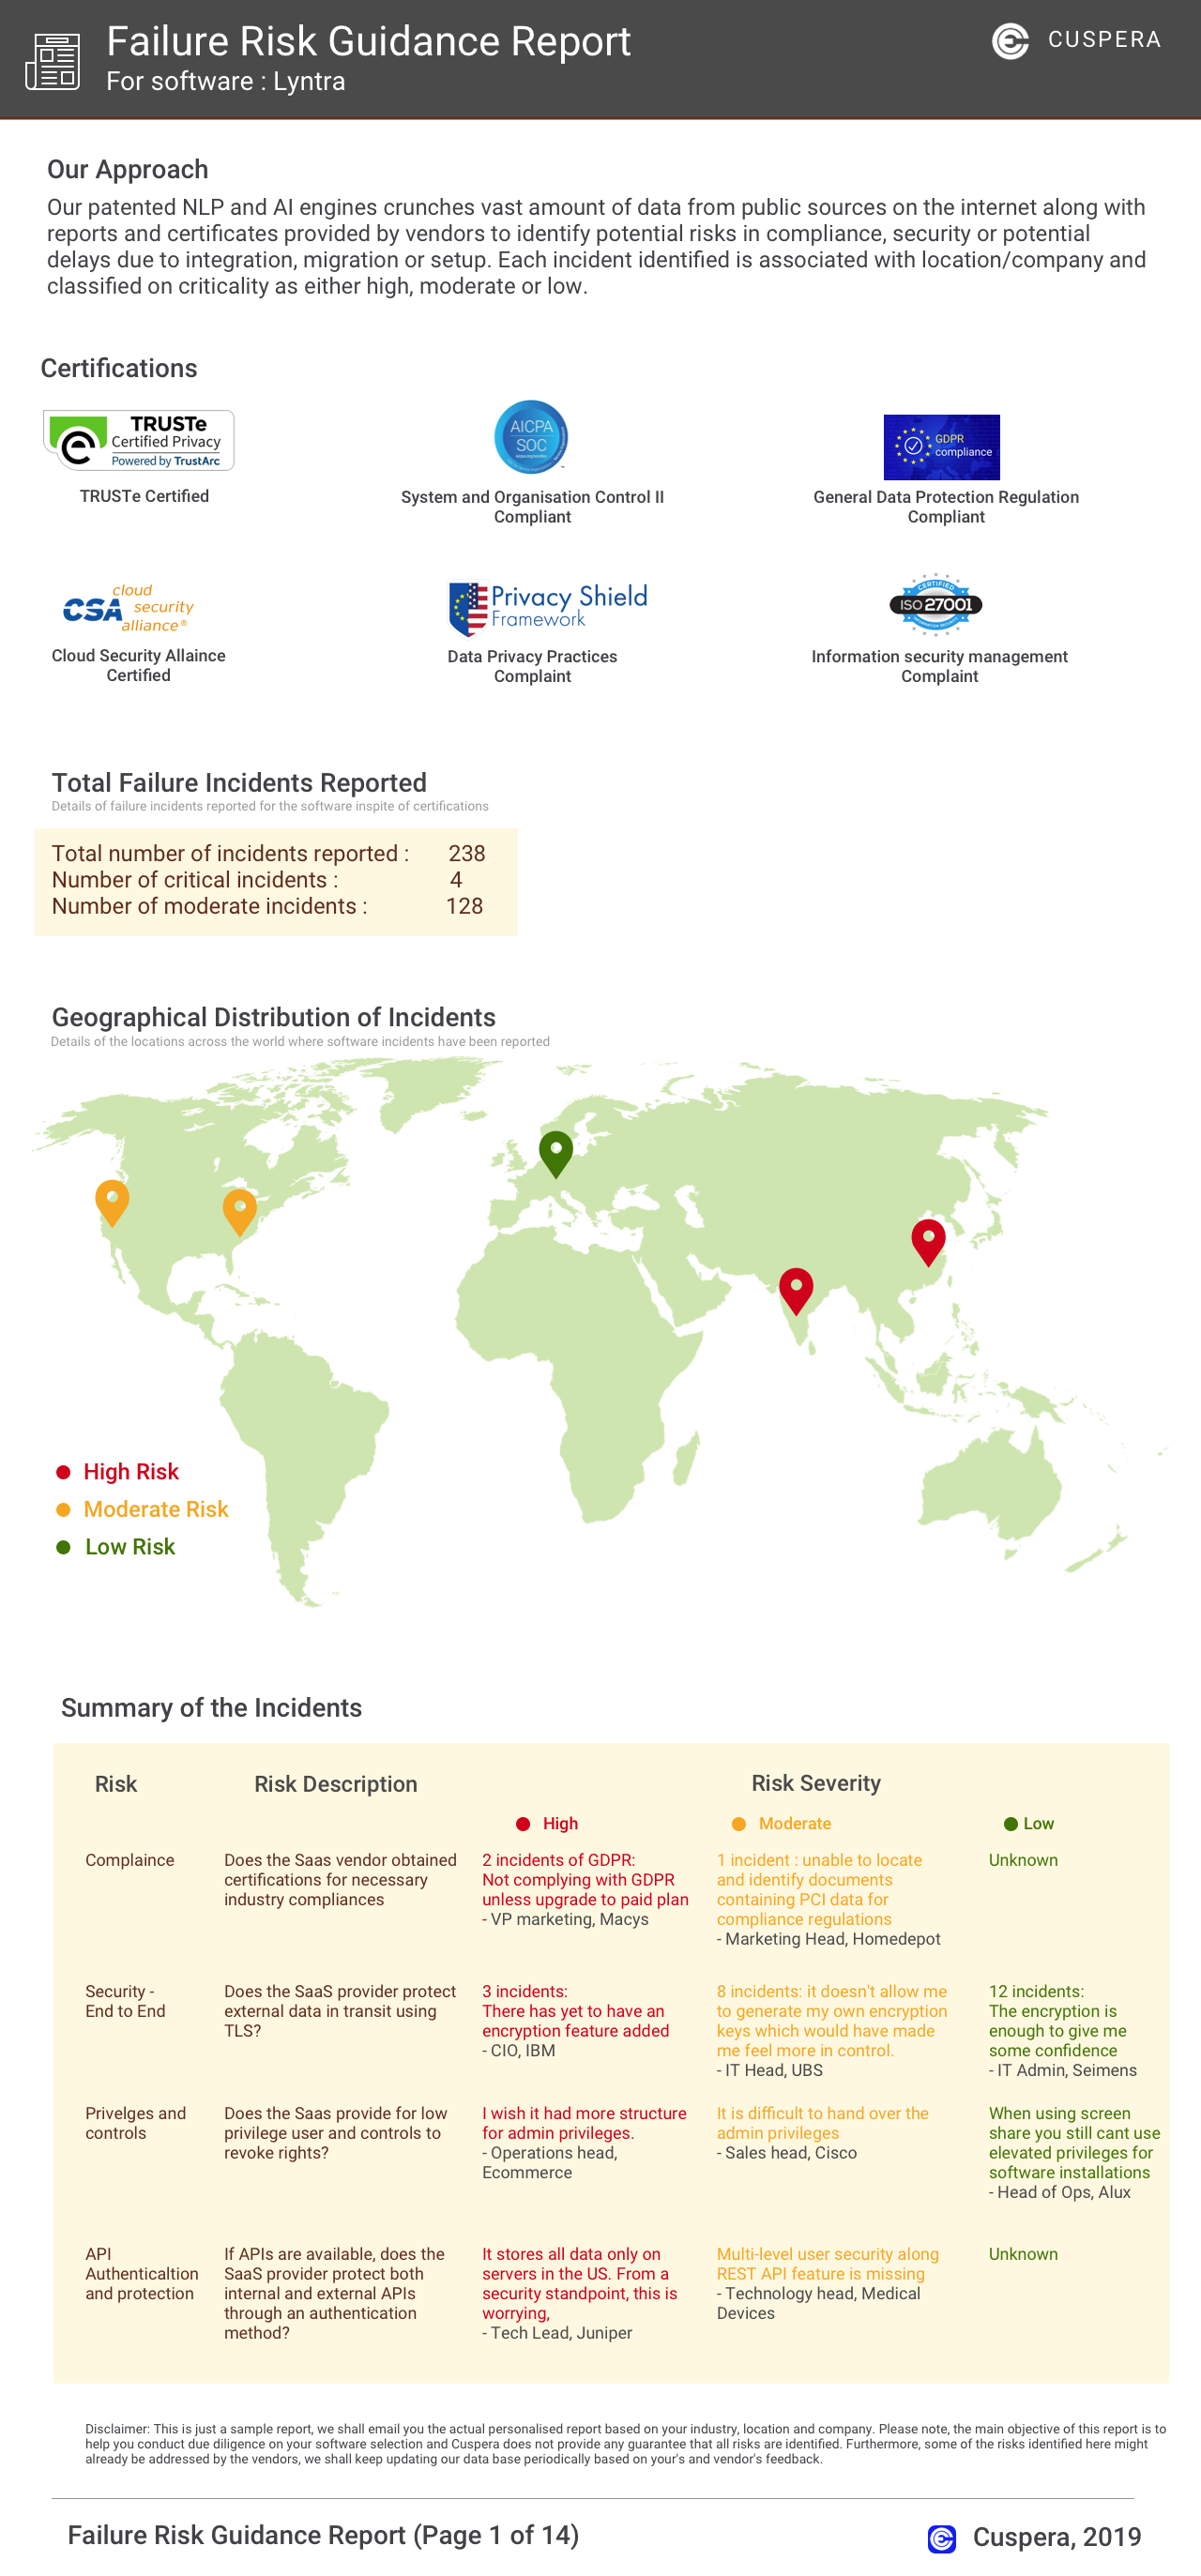
Software Failure Risk Guidance
?for Whatagraph
Overall Risk Meter
Top Failure Risks for Whatagraph
Whatagraph Profile
Company Name
Whatagraph
Company Website
https://whatagraph.com/HQ Location
Herengracht st. 182 , Amsterdam, Netherlands 1016BR, NL
Employees
51-100
Social


Financials
SERIES A

How does Whatagraph facilitate Social Media Management?