


Sigma: Analytics and Business Intelligence Platforms overview — capabilities, features, use cases and value by role
Sigma® is an Analytics and Business Intelligence platform that combines AI applications and analytics in a unified environment, enabling organizations to model, analyze, and visualize data to support decision making.
Top capabilities of Sigma
Dashboards
Read detailsSigma's Dashboards capability lets teams build interactive, data-driven dashboards on live cloud warehouse data using drag-and-drop chart elements, a rich visualization library, and explore mode for ad hoc analysis — without altering the master version — and rounds out the feature set with drill-anywhere, element lineage tracking, automated scheduled sharing, and role-based access controls. As Astronomer puts it, "What we really like about the embedded dashboards feature is how easy it's become to give new features and functionality to our customers without writing new code or issuing new platform releases." The results can move fast: Astronomer also notes that "Since we released the customer-facing dashboards, it's doubled in popularity every month!"
Embedded Analytics
Read detailsSigma's Embedded Analytics capability brings white-labeled, AI-powered analytics directly into customer-facing products through secure iFrames and a REST API with JWT authentication. Multitenant data isolation, row-level security, and role-based access controls keep each customer's data separate. The whole setup scales to thousands of customers without additional infrastructure. Emerson Group saw the impact firsthand: "Embedding Sigma reports directly into our platform changed the game. Business partners can explore data in real time on one platform." That deployment now runs more than 20 embedded dashboards in production, spanning sales, inventory, promotions, and logistics. Seek Data says, "Our partnership with Sigma has accelerated our platform journey more than 12 months, while also impacting the day-to-day capabilities and execution of every one of our clients."
Write-back
Read detailsSigma's Write-back capability, built around Input Tables, gives business users a spreadsheet-style interface to add, edit, and manage data — with every change persisted directly as a new table in the cloud data warehouse. The interface supports collaborative, multi-user workflows and scenario planning. Controlled access, audit trails, and compliance governance keep that shared data secure. As Blackstone puts it, "Input Tables from Sigma gives our employees the ability to enhance their data by adding their commentary, conducting "what-if" analysis, and telling better data stories." AB CarVal puts it directly: "Writeback changes the game. It lets us incorporate user inputs directly into our workflows, without spinning up a separate system." The practical effect shows up in how engineering teams work. At Persona, Input Tables writing back to Snowflake freed engineers from hard-coded logic so business users could update it themselves.
Self-service
Read detailsSigma's spreadsheet interface, explore mode, drag-and-drop dashboards, and 200+ functions put code-free data exploration in the hands of every user role — analysts, end users, admins, and leadership alike — while admins enforce data models and govern access through RBAC, SSO, and OAuth. As SimpleTire puts it, "The driving factor for choosing Sigma was its promise of self-service analytics—putting powerful, intuitive tools in the hands of our business users." Customer.io says that "Sigma has been instrumental in empowering our business users through self-service analytics and moving our organization to a single source of truth that allows us to make more informed, data-driven decisions." The reach of that shift is measurable: one organization increased its active data self-service users 15X, and another reported cutting reporting time by 80%.
Exploration
Read detailsSigma's Exploration capability, powered by Sigma Reveal, enables users to pivot, group, and uncover insights instantly through drag-and-drop interactions on live warehouse data — with no SQL, pre-built dashboards, or setup required. I don't like Tableau. You have to learn their own language, which is a huge barrier to entry, exploration is more difficult, and it just can't render as much data as easily. I'll never use Tableau again, and although PowerBI is cool, neither of them are capable of doing what Sigma does for our company.
Spreadsheet UX
Read detailsSigma's Spreadsheet UX connects directly to live cloud warehouse data, bringing a familiar spreadsheet-style interface — complete with 200+ formulas, pivot tables, Input Tables for governed writeback, and AI Query for generating new column values — without requiring data exports. Built says, "Since Sigma is built on this Excel interface, the spin-up time was very low." Cowen Inc. echoes that, noting "it connected directly into Snowflake and had a spreadsheet interface similar to Excel that our business teams felt comfortable with." That ease translates into measurable adoption: one customer saw daily active users expand 4X on the strength of the spreadsheet interface alone. Every cell change is tracked through a built-in audit trail, keeping the governed workbook intact as teams work.
Data Models
Read detailsSigma's Data Models capability centralizes business logic, metrics, and joins in a YAML semantic layer, letting teams define them once and reuse them across workbooks, dashboards, and AI workflows — with RBAC, approvals, and warehouse-inherited RLS keeping that context consistent organization-wide. As data.world puts it, "The dependency on our data team has shifted dramatically, freeing them up to focus on more meaningful work like data modeling and building reusable assets." Group 1001 notes that "We were able to onboard users who didn't necessarily have deep technical expertise in SQL or data modeling" — reflecting how the modular, governed layer extends access beyond technical specialists.
AI Applications
Read detailsSigma AI Applications put live analytics, governed writeback, and automated workflows into one environment built directly on the cloud data warehouse. Business teams can build and scale these apps using natural language prompts. Warehouse row-level and column-level security carries over automatically, so governance isn't a separate step.
Sigma Agents
Read detailsSigma Agents run AI-powered logic directly on warehouse compute to detect conditions and reason over business logic. From there, they can execute actions — writing back to the warehouse, triggering REST API calls, firing webhooks, and connecting to external systems like Salesforce, Jira, and Slack. Agents operate across three modes: Interactive, Autonomous, and External Actions. Security is enforced through OAuth Passthrough, which carries warehouse row-level and column-level permissions into every agent interaction.
Python / SQL
Read detailsSigma's Python / SQL capability keeps all code execution on the cloud data warehouse, running Python and SQL directly inside Sigma Workbooks alongside spreadsheet formulas. Cross-element variables hold complex analyses together across elements. Live collaborative editing means technical and business users can work in the same Workbook at the same time, each using the language they prefer.
BI & Analytics
Read detailsSigma's BI & Analytics capability covers the full path from high-level metrics down to individual transactions on live warehouse data, using a unified workspace that combines spreadsheet formulas, SQL, Python, and natural language querying. Shared datasets and data models keep metrics consistent across teams. Unrestricted drilling and linked visuals support flexible, real-time exploration without pre-built queries.
Pixel-Perfect Reports
Read detailsSigma's Pixel-Perfect Reports capability puts precise layout control in the hands of finance and operations teams, covering page breaks, headers, footers, and conditional formatting directly on live cloud warehouse data. Completed reports can be scheduled and distributed as PDF, Excel, CSV, or image to email, Slack, or cloud storage. Row-level security and version history govern every output throughout the process.
AI Toolkit
Read detailsSigma's AI Toolkit puts natural language queries, LLM-powered data enrichment, and autonomous agents in the hands of enterprise teams — all without leaving the warehouse environment. Teams can call LLM functions directly inside spreadsheet columns to enrich data on the fly. Agents can be deployed to monitor warehouse data and act on it autonomously. The toolkit also supports building AI Apps, with every capability grounded in warehouse security and semantic models. Model choice stays open: Sigma's AI Toolkit works with warehouse-native models like Snowflake Cortex and external providers such as Azure OpenAI and Anthropic.
Top features of Sigma
Input Tables (Data Writeback)
Read detailsSigma's Input Tables let end-users write data directly back to the cloud data warehouse from within embedded analytics, supporting governed data entry and scenario modeling. Customers have used Input Tables to manage dynamic data like sales targets. As Strategus puts it, Input Tables allowed them to replace Google Sheets to gather input from our team and directly put it into action. The speed difference was measurable: Strategus reports that What would have taken 20-30 seconds through the The Trade Desk API is down to one second with Sigma, resulting in huge time savings! Blackstone captures what that means for staffing: I think the biggest value driver for Sigma is that you're not using specialized Python developers to analyze billion row records anymore. You're just adding an Excel user.
Row-Level Security
Read detailsSigma handles row-level security (RLS) in embedded deployments to keep each user's data strictly isolated in multitenant environments. One customer sums up the full range of capabilities as - Workbook Embedding - Dataset creation - RLS - Filters sync - Custom Operations.
Agent Write-Back to Warehouse
Read detailsSigma Agents write actions directly back to the cloud data warehouse through the Sigma Actions framework, with every operation inheriting existing row-level and column-level security policies and logged in an immutable audit trail.
LLM AI Columns (Prompt, Classify, Sentiment)
Read detailsSigma's AI Query feature allows users to call LLM functions directly within workbook columns to classify, extract, summarize, translate, or analyze unstructured data at warehouse scale, without writing custom Python scripts or moving data. It gives us the power of AI without sacrificing security—and Sigma makes that power usable
Version History and Control
Read detailsSigma's version history gives administrators a complete record of every change made to a report definition, along with the ability to roll back to earlier states for governance and compliance purposes.
Usage and Audit Logs
Read detailsSigma exposes usage and audit logs so administrators can monitor platform-wide adoption and track user activity across all tenants in multitenant embedded deployments.
YAML-Based Model Authoring
Read detailsSigma's data modeling takes a code-first approach, building and maintaining models through YAML with full version control and CI/CD workflow compatibility for collaborative development.
Live Edit for Real-Time Collaboration
Read detailsSigma's Live Edit feature makes every keystroke visible to all participants simultaneously, supporting real-time collaboration on the same workbook.
Natural Language App Generation (Sigma Assistant)
Read detailsSigma Assistant turns a plain-language description of a workflow or application into a fully interactive UI, complete with logic and data models built directly on the warehouse — no code required. Deployments using this capability have reached 30K+ users onboarded, with 700+ active users and reported time savings of 90%.
Drill Anywhere
Read detailsSigma's Drill Anywhere feature enables users to click into any visualization and explore the raw underlying data records, with no pre-defined drill paths required.
Query History with SQL Inspection
Read detailsSigma's Query History surfaces the generated SQL, timing breakdown, and request ID for each query, giving developers and administrators what they need to troubleshoot performance and inspect the exact SQL Sigma generates.
iFrame Embedding
Read detailsSigma's embedded analytics puts full workbooks or individual visualizations inside external applications through secure iFrames, using JWT-based authentication and requiring minimal code, reaching 500k+ end users across 25k+ customers.
Excel-Like Formula Support on Live Data
Read detailsSigma's reporting interface supports standard spreadsheet formulas such as SUMIFs, LOOKUPs, and RANK applied directly on live warehouse data. This covers complex logic including period-over-period variance and weighted averages.
In-Browser Compute (Alpha Query)
Read detailsSigma's Alpha Query engine runs certain computations directly in the browser, which means fewer round-trips to the warehouse and faster results when users are exploring data interactively.
Human-in-the-Loop Approval
Read detailsSigma AI Apps keep humans in control of agentic workflows by collecting rich, real-time human inputs with governed writeback, so teams can review and approve before any agentic action is executed.
Report Endorsement
Read detailsSigma's Endorsement feature allows administrators to mark official reports as 'Trusted', directing users toward authoritative, verified content and reducing reliance on unofficial or outdated reports.
JavaScript Event Listening
Read detailsSigma's embedded analytics framework supports two-way interactivity by listening for JavaScript events fired from within the embedded iFrame, connecting the host application and the embedded content in real time.
Billion-Row Pivot Tables
Read detailsSigma turns a familiar spreadsheet interface into a direct window onto live warehouse data, handling billions of rows through drag-and-drop pivot tables with no row limitations. That approach has driven a 3x adoption increase alongside support for 300+ concurrent AB tests.
Transparent Answer Lineage and Chain-of-Thought Reasoning
Read detailsSigma Assistant and Sigma Agents make every AI-generated answer fully auditable, exposing the exact formulas, filters, and tables behind each result so users can verify accuracy rather than accept outputs on faith.
OAuth Passthrough for User Identity
Read detailsSigma passes the authenticated user's identity directly to the warehouse via OAuth Passthrough, so agents and queries can only access data that executing user is authorized to see — with zero duplicate permission models.
RBAC with Approvals
Read detailsSigma Data Modeling centralizes governance through modular, reusable data assets built on role-based access control and approval workflows. It inherits roles and row-level security directly from the warehouse rather than managing them separately. Teams have used it to consolidate 1,500 reports and simplify 33,000 objects.
REST API and API Recipes
Read detailsSigma's REST API handles embedding with minimal code, and a library of API recipes covers common tasks like onboarding new users and listing workbooks to build custom menus.
SDLC Flow Controls
Read detailsDevelopers stay in control of when changes go live across deployment environments — that is the practical upshot of Sigma's SDLC flow controls and version tagging in workbooks.
Source Swapping
Read detailsSigma's Source Swapping feature handles flexible multitenant data isolation by letting administrators swap data sources during asset deployments through admin-managed policies, removing the need to rebuild assets when switching environments.
External API Calls from Workbook Actions
Read detailsSigma AI Apps turns workbook data into a launchpad for external workflows, connecting warehouse columns and row-specific data to outside endpoints and APIs through action buttons that users can trigger directly from a workbook.
Conditional Formatting
Read detailsSigma's reporting automatically highlights variances and trends through conditional formatting, so users can spot key patterns in report data at a glance.
Cross-Element Variables Across SQL, Python, and UI
Read detailsSigma's shared variable system keeps complex multi-language analyses cohesive by letting users define a variable once and reference it across SQL, Python, and UI elements within the same workbook.
Personal Saved Views
Read detailsSigma's Explore mode separates personal analysis from the shared report. Users can reshape charts, add their own insights, and save a personal view — all without touching the underlying report.
AI-Powered Code Suggestions
Read detailsSigma's workbook editor keeps users in flow by offering smart autocomplete suggestions as they write Python or SQL code, moving them toward data actions without leaving the editor.
Access to Python Libraries
Read detailsSigma workbooks put the full suite of Python libraries directly in analysts' hands, so data analysis can happen without leaving the platform.
Signed URL Generation
Read detailsSigma generates secure, one-time-use embed URLs dynamically at runtime through a server-side API, defining user roles, access, and interaction permissions for each embedded session.
Responsive Design
Read detailsSigma's embedded visualizations automatically adapt their layout to fit mobile or desktop containers, delivering a consistent experience across device types without any additional configuration.
Localization Support
Read detailsSigma's embedded analytics adapts to customer-specific localization settings within embedded deployments. Supported settings include language, time zone, currency, and date formats, so each region gets a tailored experience.
Custom Brand Themes
Read detailsSigma AI Apps handle the visual side of application branding through no-code global themes, so teams can align their app's look and feel with their brand identity without writing code.
Page Break, Header, and Footer Control
Read detailsSigma's pixel-perfect reporting hands users direct control over page breaks, headers, and footers, so reports consistently meet corporate standards and fit standard print formats — with customers reporting 13,000+ Hours saved through the feature.
Custom Collapsible Grouping Sections
Read detailsCollapsible grouping sections make it straightforward to navigate complex financial statements and operational reports in Sigma's reporting layout controls.
Period-over-Period Time Intelligence
Read detailsSigma puts a familiar spreadsheet interface on top of live warehouse data, with built-in time intelligence functions for comparing performance month-over-month, quarter-over-quarter, and year-over-year.
Summary and Detail View Switching
Read detailsSigma's reporting interface keeps both aggregated and granular perspectives accessible within the same report, through instant toggling between summary and detail views.
Export Bursting to Personalized Per-User Slices
Read detailsSigma's Dynamic Bursting feature distributes personalized slices of data to different users from a single master report, keeping content tailored and distribution governed at scale.
Multi-Format Export (PDF, Excel, CSV, Image)
Read detailsSigma covers report delivery end to end: exports in PDF, Excel, CSV, and Image formats, sent to Email, Slack, or Cloud Storage.
Trigger-Based Conditional Sends
Read detailsSigma's scheduling system departs from fixed calendar delivery by sending reports only when specific data conditions are met. That means reports go out based on trigger-based conditional logic — not on a set timetable.
Cell-Level Formatting and Calculation
Read detailsSigma delivers a spreadsheet interface that puts cell-level control directly in users' hands, letting them format and calculate data at the lowest level of granularity on live warehouse data.
Linked Visuals with Cross-Chart Filtering
Read detailsSigma's visual analytics feature connects dashboard elements so that filtering one chart automatically updates all other visualizations, enabling cohesive interactive exploration.
Rich Chart Type Library (including Sankey and Geospatial Maps)
Read detailsSigma's visualization library covers a wide range of chart types, from Sankey diagrams to geospatial maps, along with dozens of other formats for diverse analytical needs.
Breadcrumb Context Tracking During Exploration
Read detailsSigma Reveal keeps the analysis path visible through breadcrumbs that track every grouping and filter applied during data exploration, preserving context across each drill-down step.
Interactive Handoff from Code to No-Code Exploration
Read detailsSigma's Interactive Handoff puts SQL and Python models into the hands of business users as flexible tables they can pivot and filter without writing a single line of code, closing the gap between technical and business teams.
Conversational Follow-Up Questions in Ask Sigma
Read detailsAsk Sigma lets users refine analysis through natural language follow-up questions, exploring new dimensions without returning to a blank query.
Chat-to-Workbook Conversion
Read detailsAsk Sigma converts a chat response into a live, explorable workbook on the spot. Users can drill, filter, and build directly from the answer without starting over in a separate environment.
Live Chat Human Support
Read detailsSigma backs all users with live chat from a human support team that holds an average response time of 23 seconds.
Sub-Second Query Performance at Scale
Read detailsSigma Reveal powers sub-second insights at any data scale, so users never wait for answers no matter how large the data being explored.
Pre-Defined Drill Paths
Read detailsSigma dashboards come with pre-defined drill paths that guide end-users through specific navigation routes across data hierarchies.
Custom Permissions for Report Distribution
Read detailsSigma keeps report distribution under administrator control, with custom permissions that restrict insights to authorized consumers or approved third-party integrations only.
Webhook Triggers
Read detailsSigma Agents fires webhooks to connect your data conditions to third-party systems through custom integrations. When a specific data condition is met, Sigma Agents can trigger a webhook as part of an external action framework. That webhook then kicks off whatever custom integration you've built with an outside system.
Stored Procedure Execution
Read detailsSigma AI Apps wire action buttons to stored procedures, so clicking a button can fire Python logic or kick off a downstream data workflow without ever leaving the workbook.
Data Alerts and Notifications
Read detailsSigma alerts teams and stakeholders the moment data changes meet defined criteria, pushing condition-based notifications through whichever channels have been configured.
Custom Functions
Read detailsSigma's built-in library covers 200+ spreadsheet functions, and custom functions extend that further so teams can encode calculations that match their own business logic.
Agent Scheduling and Autonomous Execution
Read detailsSigma Agents run on a schedule, watching billions of rows of live warehouse data and firing actions or notifications automatically when critical conditions are met.
Input Validation (Dropdown, Numeric Range, Required Fields)
Read detailsSigma AI Apps put data-quality controls directly on Input Tables, letting administrators configure dropdowns, numeric ranges, and required fields so that only valid data reaches the system.
Conditional Component Visibility
Read detailsSigma AI Apps adapt their interfaces dynamically by applying conditional logic that shows or hides specific UI components based on user roles, data selections, or data values.
Salesforce and Jira Integration via Action Buttons
Read detailsSigma workbook action buttons connect analytics to action by letting users update Salesforce records or create Jira tickets without leaving a workbook, driven by a trigger-and-effect framework built on if/else logic.
Query Caching and Materialized Tables
Read detailsSigma keeps expensive computation off the critical path by supporting optional query caching and materialized tables, so downstream workbooks run faster without pulling data into extracts.
Drag-and-Drop Grid Layout Builder
Read detailsSigma's workbook interface is built around a drag-and-drop grid where teams assemble dashboards and apps by placing charts, tables, text, and images — no code required.
Free Viewer License
Read detailsSigma's free viewer license tier lets end users access team dashboards without requiring a paid seat, broadening data visibility across the organization.
QuickStart Guides and Help Documentation
Read detailsSigma builds platform proficiency through QuickStart guides and comprehensive help documentation, so users can learn at their own pace.
Prebuilt Warehouse Consumption Templates
Read detailsSigma's prebuilt templates hand administrators and leadership a ready-made view of cloud warehouse consumption, so no one has to build reports from scratch.
No-SQL Query Interface
Read detailsSigma Reveal hands business users a drag-and-drop, no-SQL-required interface so they can move through data and find answers on the spot, without waiting for pre-built dashboards or writing a single query.
Drag-and-Drop Pivoting and Grouping
Read detailsSigma Reveal supports ad hoc exploration through drag-and-drop pivot, group, and insight discovery — all without requiring SQL knowledge or a pre-built dashboard.
No-Code App Layer for Business Builders
Read detailsSigma puts business teams in control of their own data applications — without spreadsheets, without rogue tools, and without writing code. The platform is built directly on top of the warehouse, so data stays governed and centralized rather than scattered across ungoverned apps. Business builders get a no-code layer they can work in themselves, and security isn't traded away to get there.
Workbook and Page Organization
Read detailsSigma organizes work into workbooks — analogous to spreadsheet files — with pages (tabs) that can contain tables, pivots, charts, filters, and text, giving data analysis a recognizable, spreadsheet-style structure.
Column-Based Calculation Pushdown
Read detailsSigma's column-based calculation model pushes all computation to the cloud data warehouse rather than handling it locally. Users define a formula once and it applies across the entire dataset automatically.
Click-Triggered Dashboard Actions
Read detailsSigma dashboards keep users inside the dashboard while they trigger actions and run interactive workflows.
Container Elements and Custom Styling
Read detailsSigma dashboards support container elements, custom styling options, and a library of data visualizations, giving teams the tools to build branded, visually compelling layouts.
Custom Chart Plug-Ins
Read detailsSigma dashboards can be extended with custom chart plug-ins, giving developers a way to build bespoke chart types beyond the built-in visualization library to meet specific analytical needs.
Warehouse-Native AI Processing
Read detailsSigma's AI processing runs entirely on cloud data warehouse compute, returning results directly to the application without extracting raw data into a separate AI engine, so security and governance controls stay intact throughout.
Execution Path Planning per Query
Read detailsSigma selects the right execution strategy for every query automatically, without user intervention. When you open a workbook, Sigma reads it and plans the optimal path on the spot. Depending on what the query needs, it chooses between cached results, in-browser calculations, or warehouse pushdown to balance speed and freshness.
Model-Agnostic LLM Configuration
Read detailsSigma is completely model-agnostic by design. Administrators can configure it to use any enterprise-approved LLM, including Anthropic, Azure OpenAI, or warehouse-native models like Snowflake Cortex, without being locked into a specific AI vendor.
dbt Semantic Model Grounding
Read detailsSigma Assistant and Sigma Agents anchor every AI-generated answer in pre-approved metric definitions by reasoning over business logic defined in dbt semantic models, rather than drawing conclusions from raw data inference.
No-Code Agent Builder (Spreadsheet Interface)
Read detailsSigma removes the engineering dependency from agent creation entirely — non-technical builders can define agent behavior, conditions, and thresholds directly in a spreadsheet interface, with no Python, SQL, or engineering tickets required.
Automatic Data Model Sync
Read detailsSigma keeps agent behavior in sync with the underlying data model automatically, because every agent action compiles to SQL against the warehouse's semantic layer. When the data model changes, agent behavior updates with it — no manual code rewrites required.
Reusable Tables, Metrics, Joins, and Relationships
Read detailsSigma's data modeling supports publishing tables, metrics, joins, and relationships once, then reusing them across workbooks, dashboards, and AI workflows to keep business logic consistent organization-wide.
Contextual Annotation Alongside Warehouse Data
Read detailsSigma's Input Tables place important context and annotations directly alongside live warehouse data, enriching analysis without touching the source dataset.
Top use cases for Sigma
Close books and plan financials collaboratively
Read detailsFinance, FP&A, accounting, and treasury teams use Sigma to work directly on live warehouse data — closing books, building collaborative budgets, and forecasting cash positions without manual exports or emailed spreadsheets. Controllers input journal entries and sign off on consolidated P&Ls. Department owners model scenarios against live GL data. Treasury teams project cash positions across entities.
Automate monitoring and trigger enterprise workflows with AI agents
Read detailsSigma Agents let enterprise teams run scheduled monitoring across billions of rows of live warehouse data, detecting anomalies or threshold breaches automatically. When a condition is met, Agents can write back to the warehouse, trigger REST API calls, update Salesforce opportunities, create Jira tickets, or dispatch Slack alerts. All of this runs with inherited warehouse security and an immutable audit trail. Teams can begin with human-in-the-loop approval and move to full autonomous execution as institutional trust grows.
Build and deploy operational AI applications
Read detailsSigma takes business teams from a natural-language prompt to a production-ready AI application built natively on the cloud data warehouse. Live analytics, governed writeback via Input Tables, and automated actions through the Sigma Actions framework combine in a single workflow. Organizations use this to consolidate fragmented SaaS tools, automate processes like forecasting and inventory management, and embed agentic logic — all without writing code and with security inherited from the warehouse.
Optimize supply chain and logistics operations
Read detailsSupply chain planners, regional forecasters, and operations teams use Sigma to model tariff impacts, unify demand forecasting, track vendor performance, and control transportation spend. This happens by querying live ERP and WMS data directly in the warehouse — no extract, no delay. Teams use Input Tables to submit local forecasts, adjust stock allocations, and trigger replenishment workflows before disruptions reach customers, replacing disconnected spreadsheets with a single governed platform.
Produce and distribute boardroom-ready reports
Read detailsFinance and operations teams can replace manual export-to-Excel cycles with centralized, governed reporting built directly on live warehouse data — that is what Sigma delivers here. Pixel-perfect financial statements and operational reports are built once, with row-level security, version history, and endorsement controls enforcing consistent logic across the organization. Governed distribution then reaches thousands of stakeholders automatically through scheduled PDF bursting, email, Slack, or cloud storage.
Manage sales performance and revenue operations
Read detailsSigma puts RevOps leaders, sales managers, and reps directly on top of live warehouse data for sales and revenue workflows. Teams use it to model territories, validate pipeline health, automate commission logic, and attribute revenue. Managers can join CRM opportunities with product usage logs and billing data to surface churn risks and upsell signals. From there, they can drill into deal-level email and meeting transcripts to coach reps and unblock stalled deals.
Value delivered by role with Sigma
Sales
Read detailsSigma serves sales teams and revenue operations leaders who need to act on pipeline data without writing SQL. More than 150 sales reps can explore their own performance data directly, with transaction-level visibility into variable comp plans that reduces disputes and shadow accounting. RevOps leaders use Input Tables to adjust capacity models, write quota targets back to the warehouse, and run live territory balancing and pipeline scenario modeling. As data.world puts it, "A key moment for us during the evaluation was involving different personas from across the company—RevOps, customer success, finance—and seeing how far they could get with Sigma on their own." Greenwich.HR says, "We're projecting WageScape—powered by Sigma—will give us seven-digit revenue from new incremental sales in the first year of operations."
Product
Read detailsProduct teams gain direct access to operational and behavioral data—seeing who comes into the app, what they do, what they buy, and how features perform—enabling faster, more confident product decisions without waiting on the data team. Sigma is really unique in the fact that we can embed this product within our entire application and then enable customers to build their own reports
Finance
Read detailsSigma's spreadsheet-native interface lets finance teams work directly against live data, cutting report creation time 6X faster and compressing monthly close from two weeks to three or four business days. Analysts can adjust assumptions in real time and see downstream impact instantly. No IT tickets. No emailed files. As Cowen Inc. puts it, "Reports that used to take me an hour or more weekly I can put together in under ten minutes." As Greenland Capital Management puts it, "Sigma accelerates our financial analysts' ability to make contributions. Without Sigma, involving analysts on this level would be very difficult."
Marketing
Read detailsSigma serves marketing teams with real-time campaign performance visibility and self-service analytics across email, direct mail, and digital channels, enabling rapid filtering of billions of rows of customer data to build targeted cohorts and trace the complete buyer journey from first impression to purchase — capabilities that helped one deployment compress decision time by 40% and capture a 15% revenue lift. As Migo puts it, "Sigma made the transition from growth marketing to recovery marketing exponentially faster, easier, and more successful." That same team increased recovery campaign response rate by 47% and improved overall ROI on marketing campaign spend by 11%, while Amuse confirms that "Every team at Amuse is analyzing data in Sigma. Finance, operations, marketing, analytics, central ops — it's a lot of people."
Data Engineer Business Intelligence Solutions | Sigma
Read detailsSigma helps data and BI teams build scalable, reusable data products that Finance, SalesOps, and other business teams can use independently for cohort analysis, forecasting, and scenario modeling. That self-service shift has real consequences for engineering capacity: one customer freed 15+ engineers and data scientists from routine reporting tasks, enabling them to focus on strategic work like data modeling and algorithm development. As PowerToFly puts it, "We are now saving weeks of engineering work because we are not relying on a single person and non-techie folks can roll up their sleeves in Sigma and visualize to their heart's content." data.world describes a similar shift: "We've gone from having a ticket-driven process where every dashboard request had to be routed through the data team, to enabling users to dive into existing reports, tweak them, or even create new views entirely on their own."
Analyst
Read detailsSigma cuts the routine reporting burden that once consumed analyst bandwidth, with customers reporting 15–20 hours per week reclaimed from manual report building. Teachable says, "We have reduced two full time employees doing virtually nothing but answering ad-hoc data requests to half of one full time employee's time spent on ad-hoc requests." Analysts work in Python, SQL, spreadsheet functions, or AI to process billions of records in seconds and iterate live with colleagues, redirecting the hours saved to analysis and client engagement. As Dutch Pet puts it, "It's like having another analyst on the team—one that's 10x faster than I am."
Business Leader Analytics | Sigma
Read detailsSigma moves C-suite leaders off static slide decks and onto live dashboards as their primary source of truth, giving executives self-service access to sales, financial, and operational data for faster decisions. Armstrong Transport Group describes the before-state plainly: "Most of our reporting was manual and weekly at best. Leadership had no real-time visibility into lanes, relationships, or profitability. We couldn't scale those insights without a complete overhaul of our data stack." Sigma replaces that lag with real-time visibility. As Emerson Group puts it, "The standardized retailer dashboard has provided visibility to the essential metrics, giving leadership the ability to make faster, more informed decisions." That same live-data access extends to embedded analytics, where organizations unlock new revenue streams, cut costs, and launch new product SKUs by turning data into a competitive advantage.
Analytics Engineer
Read detailsSigma targets analytics engineers with a dedicated workflow for building governed, reusable data products. Curated datasets can be published and data models tested directly in Sigma, without waiting on engineering. Both technical and non-technical teams then self-serve from a single source of truth, breaking down data silos across the organization.
Role: Developer
Read detailsSigma is built for development teams that need to embed analytics into their own software products without a lengthy engineering lift. The platform connects directly to cloud warehouses and is designed so embedded deployments can go live in days rather than months. It also serves as a proving ground for concepts that can later be handed off to engineering teams, reducing the need for dedicated resources on every new dashboard or report. As Wurl puts it, "The polished capabilities and features have made the work for front-end developers a lot more fun. Sigma just works. We haven't had any problems, and with more and more customization options, we're able to tell better data stories."
Supply Chain
Read detailsSupply chain and operations teams explore, pivot, and model billions of rows of live data using Sigma's spreadsheet UI directly on the warehouse, with data never leaving the governed perimeter so reports are always current, auditable, and actionable. We recently added a new product line—custom hats. In the past, setting up the data infrastructure for something like that would have taken weeks. With Sigma, we updated the dataset, and the operations team analyzed the new product's performance right away.
What customers say about Sigma: ratings, outcomes and feedback
Sigma Computing® customers are clear about what works for them and what doesn't in day-to-day use. They point to practical strengths they rely on, and they're equally direct about the friction points they encounter.
What works well
After being in business for nearly 50 years, our teams can finally access and leverage all our legacy data to improve our products and services. Sigma® helps give us that competitive advantage. source
Where customers see room for improvement
Sigma has a handful of recurring limitations that customers flag: performance under heavy workbooks, advanced-feature discoverability, AI integrations, and customization flexibility. Performance can slip under load. As one Mid-Market customer puts it, "Gets a bit laggy when workbooks have a lot going on lots of elements, big datasets, that kind of thing." That same customer notes it's not a dealbreaker, but the friction is real. Advanced features take some independent exploration to master. A Mid-Market user notes that "Some of the advanced features aren't super intuitive at first, you kind of have to figure them out on your own." Related to this, customers also ask for better-structured training resources organized by specific use cases. On the integration side, one customer sees room to expand AI tool integrations beyond what Sigma currently offers. Separately, one customer would appreciate custom color filters from a viewer standpoint. One customer also calls out table formatting options and multi-join handling as areas for improvement. And one customer finds it occasionally difficult to make the Sigma panel match the surrounding application design precisely.
Sigma Analytics Customer wins, Case studies
Frequently Asked Questions (FAQ)
What buyers ask before choosing Sigma Analytics
Integrations What CRM integrations are available for Sigma Analytics?
Sigma Analytics offers several CRM integrations to enhance data analysis and reporting capabilities. Notably, it integrates with Slack, allowing users to schedule reports and share insights directly within their team communication channels. This integration facilitates real-time collaboration and ensures that stakeholders have access to the latest data without switching platforms. Additionally, Sigma supports integration with LinkedIn Ads, enabling marketers to analyze campaign performance and optimize their strategies based on live data. These integrations empower businesses to leverage their CRM data effectively, streamline workflows, and make informed decisions based on comprehensive analytics. By utilizing these integrations, organizations can enhance their data-driven strategies and improve overall operational efficiency.
Integrations How does Sigma Analytics connect to Salesforce and HubSpot?
Sigma Analytics connects to Salesforce and HubSpot through seamless integrations that allow users to access and analyze data from these platforms directly within Sigma's cloud-native environment. By integrating with Salesforce, businesses can pull customer relationship management data, enabling teams to create insightful dashboards and reports that enhance sales strategies and customer engagement. Similarly, the HubSpot integration allows users to visualize marketing metrics and campaign performance, facilitating data-driven decision-making. These integrations empower users to leverage real-time data from both platforms, fostering collaboration and improving overall business intelligence. With Sigma's user-friendly interface, even non-technical users can explore and manipulate this data without needing extensive coding knowledge, making it easier to derive actionable insights from their Salesforce and HubSpot data.
Integrations What are the setup steps for integrating Sigma Analytics with Marketo?
To integrate Sigma Analytics with Marketo, start by ensuring you have access to both platforms and the necessary permissions. First, log into your Sigma account and navigate to the data connections section. Select Marketo from the list of available integrations. You will need to provide your Marketo API credentials, which can be obtained from your Marketo account settings under the API section. Once connected, configure the data sync settings to determine which Marketo data you want to import into Sigma, such as leads, campaigns, or engagement metrics. After setting up the data flow, test the connection to ensure data is being pulled correctly. Finally, create dashboards in Sigma to visualize and analyze your Marketo data, enabling your marketing team to make data-driven decisions efficiently.
Integrations Is there API access for Sigma Analytics, and how does it work?
Yes, Sigma Analytics provides API access, allowing users to integrate its powerful analytics capabilities into their existing workflows and applications. The API enables developers to programmatically interact with Sigma's features, such as uploading data, scheduling reports, and retrieving analytics results. This functionality is particularly beneficial for businesses looking to automate data processes or embed analytics into their own applications. By leveraging the API, organizations can streamline their data analysis workflows, enhance reporting capabilities, and ensure that insights are readily available across various platforms. This integration fosters a more data-driven culture within organizations, empowering teams to make informed decisions based on real-time analytics.
Integrations What is the data flow between Sigma Analytics and external data providers?
The data flow between Sigma Analytics and external data providers involves a seamless integration process that allows users to connect and analyze data from various sources, such as cloud warehouses like Snowflake and Databricks. Users can upload specific CSV files to join with existing datasets, enabling them to create comprehensive reports and dashboards. Sigma facilitates real-time data access, allowing business users to explore and visualize data without needing extensive technical expertise. This self-service capability empowers teams to generate insights quickly, reducing reliance on IT for reporting. By streamlining the data flow, Sigma enhances decision-making efficiency and enables organizations to leverage their data more effectively, ultimately driving business growth and improving operational performance.
Integrations What is the data flow between Sigma Analytics and LinkedIn Ads?
The data flow between Sigma Analytics and LinkedIn Ads involves the integration of LinkedIn Ads data into Sigma's analytics platform, allowing businesses to analyze their advertising performance in real-time. When LinkedIn Ads campaigns are run, data such as impressions, clicks, conversions, and other key metrics are collected. This data can then be automatically imported into Sigma Analytics, where users can create custom dashboards and reports to visualize and interpret the performance of their campaigns. By leveraging Sigma's capabilities, teams can track the effectiveness of their LinkedIn Ads, optimize marketing strategies, and make data-driven decisions to enhance customer engagement and ROI. This integration ultimately streamlines the reporting process and empowers non-technical users to access and analyze their advertising data efficiently.
Integrations Are there any limitations to the integrations available with Sigma Analytics?
While Sigma Analytics offers a range of integrations, including popular platforms like Slack and LinkedIn Ads, there are some limitations to consider. Users have reported challenges with searching for specific charts within workbooks and a lack of clear areas for testing one-off questions, which can hinder the overall user experience. Additionally, while Sigma supports various data sources and allows for the uploading of CSV files, the integration capabilities may not cover every tool or platform that businesses use, potentially requiring additional manual processes. Therefore, while Sigma provides robust integration options, businesses should evaluate their specific needs to ensure compatibility with their existing systems and workflows.
Integrations Are there any limitations to the integrations offered by Sigma Analytics?
While Sigma Analytics offers a range of integrations, including popular platforms like Slack and LinkedIn Ads, there are some limitations to consider. Users have reported challenges with searching for specific charts within workbooks and a lack of a clear area for testing one-off questions, which can hinder the overall user experience. Additionally, while Sigma provides robust capabilities for data analysis and reporting, the search functionality can be cumbersome, making it difficult to navigate through integrated data sources efficiently. Therefore, while Sigma's integrations enhance its functionality, users may encounter usability issues that could affect their workflow and data exploration processes.
Features What does the dashboard creation feature in Sigma Analytics do?
The dashboard creation feature in Sigma Analytics allows users to build, customize, and share interactive dashboards that visualize data in real-time. This feature empowers both technical and non-technical users to create dashboards without needing extensive coding knowledge, facilitating self-service analytics. Users can easily connect various data sources, such as CSV files or databases, and utilize built-in chart options like pie, gauge, and Sankey charts to represent their data effectively. Additionally, Sigma's intuitive interface streamlines the process of dashboard creation, enabling teams to automate reporting and collaborate seamlessly. This capability not only enhances data accessibility across the organization but also significantly reduces the time spent on manual reporting, allowing teams to focus on data-driven decision-making.
Features How do I create a dashboard using Sigma Analytics?
To create a dashboard using Sigma Analytics, start by logging into your Sigma account and selecting the dataset you want to visualize. You can upload a CSV file if needed, or choose from existing data sources. Once your data is ready, use the intuitive drag-and-drop interface to create visualizations such as charts or tables. You can customize your dashboard by adding hidden tabs or intermediary tables for more complex analyses. After arranging your visualizations, save your dashboard and set up recurring reports to share insights via email or Slack. Sigma's user-friendly design allows even non-technical users to build and modify dashboards quickly, enhancing collaboration and data accessibility across your organization.
Features What is the process for automating reports in Sigma Analytics?
Automating reports in Sigma Analytics involves a straightforward process that enhances efficiency and data accessibility. First, users can create a report by selecting the desired data sources and visualizations within the Sigma platform. Once the report is set up, users can schedule it for automatic delivery by navigating to the scheduling options, where they can specify the frequency (daily, weekly, etc.) and the recipients via email or Slack. Additionally, Sigma allows for the creation of hidden tabs or intermediary tables to streamline data processing before final reporting. This automation not only saves time but also ensures that stakeholders receive timely insights without manual intervention, ultimately boosting productivity and collaboration across teams.
Features What functionality does Sigma's data visualization tool provide?
Sigma Computing's data visualization tool offers a robust set of functionalities designed to enhance data analysis and reporting. Users can easily upload CSV files to join datasets, create dynamic dashboards, and generate various types of charts, including gauge, pie, and Sankey charts. The platform supports automated report scheduling via Slack or email, enabling teams to stay updated effortlessly. Additionally, Sigma allows for the creation of hidden tabs and intermediary tables, facilitating complex data manipulations. While it excels in user-friendliness and accessibility for non-technical users, it does have limitations, such as challenges in custom ordering pivot fields and searching for specific charts within workbooks. Overall, Sigma's tool empowers organizations to derive actionable insights from their data efficiently.
Features How can non-technical users access and analyze data in Sigma Analytics?
Non-technical users can access and analyze data in Sigma Analytics through its user-friendly interface designed for ease of use. The platform allows individuals without a data background to upload CSV files, create dashboards, and generate reports without needing extensive technical knowledge. Users can leverage built-in features to create charts from various data sources, including tables and other CSVs, facilitating self-service analytics. Additionally, Sigma supports scheduling automated reports and sharing insights via Slack or email, making it convenient for teams to stay informed. With Sigma, organizations like Duolingo and Teachable have empowered their non-technical staff to explore data independently, significantly reducing reliance on engineering teams for routine reporting and accelerating decision-making processes.
Features How can non-technical users analyze data directly in Sigma Analytics?
Non-technical users can analyze data directly in Sigma Analytics through its intuitive, Excel-like interface that simplifies data exploration and visualization. The platform allows users to upload CSV files and create charts based on various data sources without needing extensive technical skills. With features like hidden tabs for intermediary tables and the ability to schedule reports via Slack or email, users can easily manage their data analysis tasks. Sigma also empowers teams by enabling them to build their own dashboards quickly, significantly reducing reliance on engineering teams for routine reporting. This self-service capability not only enhances productivity but also fosters a data-driven culture within organizations, as seen in companies like Duolingo and Teachable, where non-technical staff can generate insights and make informed decisions rapidly.
Features What features support real-time data entry and analysis in Sigma Analytics?
Sigma Analytics offers several features that support real-time data entry and analysis, making it an effective tool for organizations seeking immediate insights. The platform allows brand managers and other users to enter and analyze data in real time, eliminating bottlenecks and reducing reliance on IT. Its Excel-like interface facilitates easy adoption across departments, enabling non-technical users to perform analyses without needing assistance from the BI team. Additionally, Sigma supports live data access, allowing teams to collaborate on real-time information and make faster decisions. The ability to create dashboards quickly and automate reports further enhances the efficiency of data analysis, empowering users to respond to changing business conditions promptly. Overall, these features contribute to a unified, collaborative analytics environment that streamlines data-driven decision-making.
Features What features support automated reporting in Sigma Analytics?
Sigma Analytics offers several features that support automated reporting, making it easier for teams to manage their data efficiently. Users can easily set up recurring reports on a defined schedule, whether for themselves or their teams, ensuring timely insights without manual intervention. The platform allows for the creation of hidden tabs and intermediary tables, which can streamline the reporting process. Additionally, Sigma supports automated exports and the embedding of reports, enhancing accessibility and collaboration. With its user-friendly interface, even non-technical users can automate their reporting tasks, significantly reducing the time spent on routine data requests. This functionality not only boosts productivity but also empowers teams to focus on data analysis rather than data gathering.
Features How do I use Sigma Analytics to track promotions and sales trends?
To use Sigma Analytics for tracking promotions and sales trends, start by integrating your sales data sources, such as your CRM or e-commerce platform, into Sigma's cloud-native platform. Once your data is connected, create a new dashboard tailored to your promotional campaigns by selecting relevant metrics like sales volume, conversion rates, and customer engagement. Utilize Sigma's low-code interface to build visualizations that highlight trends over time, allowing you to compare performance across different promotions. You can also set up automated reports to refresh data regularly, ensuring you have real-time insights. Additionally, leverage Sigma's collaborative features to share dashboards with your marketing and sales teams, enabling them to make data-driven decisions quickly and effectively.
Features How do I use Sigma Analytics to track engagement and spot patterns?
To use Sigma Analytics for tracking engagement and spotting patterns, start by uploading your relevant data, such as user interaction logs or engagement metrics, in CSV format. Utilize Sigma's powerful data visualization tools to create charts and dashboards that represent this data visually, allowing you to identify trends and patterns easily. Schedule regular reports to be sent via Slack or email to keep your team updated on engagement metrics. Additionally, leverage the ability to create hidden tabs or intermediary tables for more complex analyses without cluttering your main dashboards. By enabling non-technical users to access and analyze data directly, Sigma Analytics empowers your team to make data-driven decisions quickly, enhancing overall engagement strategies.
ROI & pricing What measurable business outcomes can Sigma Analytics provide?
Sigma Analytics can deliver significant measurable business outcomes across various industries by enhancing data accessibility and decision-making efficiency. For instance, Migo's marketing team experienced a 47% increase in recovery campaign response rates and an 11% improvement in ROI on marketing spend after utilizing Sigma for real-time data analysis. Similarly, Makena Capital reduced analyst reporting time by 50%, allowing analysts to focus on investment decisions rather than data assembly, while Teachable saw a 70% reduction in ad-hoc data requests, leading to a fivefold increase in dashboard creators. JamLoop achieved a 67% reduction in analytics costs and a 120% boost in new customer growth by switching to Sigma. These outcomes illustrate how Sigma Analytics empowers teams to make faster, data-driven decisions, ultimately driving business growth and operational efficiency.
ROI & pricing What measurable business outcomes can I expect from using Sigma Analytics?
Using Sigma Analytics can lead to significant measurable business outcomes across various industries. For instance, Migo's marketing team experienced a 47% increase in recovery campaign response rates and an 11% improvement in ROI on marketing spend after leveraging Sigma for real-time data access. Similarly, Teachable reduced ad-hoc data requests by over 70%, allowing their data team to focus on more strategic tasks, while JamLoop cut analytics costs by 67% and improved data refresh rates, resulting in a 120% boost in new customer growth. Additionally, Makena Capital saved 10-20 hours per week by streamlining reporting processes, enabling analysts to concentrate on investment decisions. Overall, Sigma empowers teams to make faster, data-driven decisions, enhances collaboration, and improves operational efficiency, leading to tangible business benefits.
ROI & pricing How does Sigma Analytics improve ROI on marketing spend?
Sigma Analytics improves ROI on marketing spend by providing real-time data access and self-service analytics capabilities that empower marketing teams to make informed decisions quickly. For instance, Migo's marketing team utilized Sigma to pivot their strategy within 30 days, resulting in a 47% increase in recovery campaign response rates and an 11% improvement in ROI. By replacing manual reporting processes with Sigma's cloud-native platform, teams can analyze campaign performance and customer engagement metrics more efficiently, leading to better-targeted marketing efforts. Additionally, Sigma's ability to create live dashboards allows for continuous monitoring and optimization of campaigns, ensuring that marketing budgets are allocated effectively to maximize returns. This streamlined approach not only enhances collaboration among teams but also drives faster decision-making, ultimately contributing to improved financial outcomes.
ROI & pricing What are the different pricing plans available for Sigma Analytics?
Sigma Analytics offers a range of pricing plans tailored to meet the diverse needs of businesses looking for data analytics solutions. While specific pricing details are not provided in the context, it is common for analytics software to offer tiered plans based on features, user access, and support levels. Typically, these plans may include options for small businesses, enterprise solutions, and possibly free trials or freemium models for users to explore basic functionalities. To get the most accurate and up-to-date information on Sigma Analytics' pricing plans, it is advisable to visit their official website or contact their sales team directly, as they can provide detailed insights into the various options available and help you choose the best plan for your business needs.
ROI & pricing What is the total cost of ownership for using Sigma Analytics?
The total cost of ownership (TCO) for using Sigma Analytics encompasses several factors, including subscription fees, implementation costs, training expenses, and ongoing maintenance. While specific pricing details may vary based on the size of your organization and the features you choose, Sigma Analytics is designed to provide significant cost savings by reducing the time spent on manual reporting and data assembly. For instance, companies like Makena Capital and Teachable have reported substantial reductions in analyst reporting time and ad-hoc data requests, translating to lower operational costs and increased productivity. Additionally, Sigma's self-service capabilities empower non-technical users to access and analyze data independently, further enhancing the value proposition. To get a precise estimate tailored to your business needs, it's advisable to contact Sigma Analytics directly for a customized quote.
ROI & pricing What is the total cost of ownership for implementing Sigma Analytics?
The total cost of ownership (TCO) for implementing Sigma Analytics includes several factors such as subscription fees, training costs, and potential integration expenses. While specific pricing details are not provided, Sigma Analytics is known for its competitive pricing compared to other business intelligence tools like Tableau and Domo, which can be more complex and costly. Additionally, organizations may incur costs related to onboarding and training staff to effectively use the platform. However, many users report significant savings in time and resources, as Sigma enables self-service analytics and reduces reliance on IT for reporting, ultimately leading to a lower TCO over time. Businesses can expect to see a return on investment through improved efficiency and faster decision-making capabilities.
ROI & pricing How quickly can businesses expect to see value from implementing Sigma Analytics?
Businesses can expect to see significant value from implementing Sigma Analytics within a short timeframe, often as quickly as 30 days. For instance, Migo's marketing team was able to pivot their strategy and improve recovery campaign response rates by 47% shortly after adopting Sigma. Similarly, Duolingo achieved a 91% user adoption rate within just 90 days, allowing teams to run over 300 AB tests simultaneously and create dashboards quickly. Sigma's user-friendly, Excel-like interface facilitates rapid onboarding and empowers non-technical users to access and analyze data independently, leading to faster decision-making and improved collaboration across departments. Overall, companies can anticipate enhanced operational efficiency and better data-driven insights almost immediately after implementation.
ROI & pricing How quickly can I see value from Sigma Analytics after implementation?
After implementing Sigma Analytics, users can expect to see significant value within a remarkably short timeframe. For instance, companies like Duolingo reported that 91% of eligible users adopted the platform within just 90 days, enabling teams to quickly create dashboards and run over 300 A/B tests simultaneously. Similarly, Migo's marketing team was able to pivot their strategy in just 30 days, resulting in a 47% increase in recovery campaign response rates. Sigma's user-friendly, Excel-like interface allows non-technical users to access and analyze data directly, which accelerates decision-making and enhances collaboration across departments. Overall, organizations can experience improved reporting efficiency and actionable insights in a matter of weeks, making Sigma a valuable tool for driving business outcomes swiftly.
ROI & pricing What cost savings can companies achieve by using Sigma Analytics?
Companies can achieve significant cost savings by using Sigma Analytics through enhanced efficiency and reduced reliance on technical resources. For instance, JamLoop reported a 67% reduction in analytics costs after switching from Domo to Sigma, benefiting from faster and more flexible reporting capabilities. Similarly, Sigma helped Makena Capital cut analyst reporting time by 50%, allowing analysts to focus on investment decisions rather than data assembly, which translates to substantial labor cost savings. Additionally, organizations like Teachable experienced a 70% decrease in ad-hoc data requests, freeing up their data teams to concentrate on more strategic tasks. By streamlining data access and empowering non-technical users, Sigma Analytics not only reduces operational costs but also drives better decision-making, ultimately leading to improved ROI across various business functions.
ROI & pricing What cost savings can businesses achieve by using Sigma Analytics?
Businesses can achieve significant cost savings by using Sigma Analytics, as evidenced by various case studies. For instance, JamLoop reported a 67% reduction in analytics costs after switching from Domo to Sigma, benefiting from faster and more flexible reporting capabilities. Similarly, Sigma helped Makena Capital cut analyst reporting time by 50%, allowing analysts to focus on investment decisions rather than manual data assembly, which translates to substantial labor cost savings. Teachable experienced a 70% decrease in ad-hoc data requests, freeing up their data team to concentrate on more strategic tasks. Overall, Sigma's cloud-native platform enhances efficiency, reduces reliance on technical resources, and enables teams to make data-driven decisions quickly, leading to improved ROI and operational cost reductions across various departments.
Capabilities What data types can Sigma Analytics handle?
Sigma Analytics is designed to handle a wide variety of data types, making it a versatile tool for data analysis. It can process structured data, such as CSV files, which users can easily upload for analysis. Additionally, Sigma Analytics supports unstructured data, allowing users to create charts and reports based on diverse data sources, including databases and other tables. The platform's capabilities extend to handling large datasets typical in big data analytics, enabling users to perform complex analyses and generate insights. This flexibility in data handling not only enhances the analytical process but also empowers businesses to make data-driven decisions effectively, regardless of the data format they are working with.
Capabilities Can Sigma Analytics support real-time data analysis for large datasets?
Yes, Sigma Analytics can effectively support real-time data analysis for large datasets. The platform is designed to enable non-technical users to create dashboards and access live data without relying on IT, which significantly speeds up decision-making processes. For instance, companies like DoorDash have successfully utilized Sigma to increase their query volume by 30% while maintaining flat costs with Snowflake, allowing 12,000 internal users to edit dashboards and access real-time data. Additionally, Blackstone has leveraged Sigma to analyze billion-row datasets in hours rather than days, showcasing its capability to handle large volumes of data efficiently. This real-time analytics functionality empowers teams to make informed decisions quickly, enhancing overall business agility.
Capabilities Does Sigma Analytics provide built-in security and compliance features?
Yes, Sigma Analytics provides built-in security and compliance features that ensure data integrity and protection. The platform is designed to support secure and governed data entry, allowing teams to analyze and manage sensitive information without compromising security. This includes automated workflows that centralize large volumes of data, enabling fast and secure analysis while maintaining compliance with industry regulations. Additionally, Sigma's architecture allows for user-friendly access to analytics for non-technical users while ensuring that sensitive data remains protected. This dual focus on accessibility and security empowers organizations to leverage data insights effectively while adhering to necessary compliance standards, making Sigma a robust choice for businesses prioritizing data governance.
Capabilities Does Sigma Analytics provide secure and compliant data governance features?
Yes, Sigma Analytics provides secure and compliant data governance features that are essential for organizations managing sensitive information. The platform supports secure, governed data entry, ensuring that data integrity and security are maintained throughout the analytics process. This is particularly valuable for businesses that require strict compliance with data regulations. Sigma's framework allows for controlled access to data, enabling teams to collaborate effectively while safeguarding sensitive information. Additionally, the platform's capabilities facilitate the identification and resolution of discrepancies in data, further enhancing governance. By empowering users to analyze data without compromising security, Sigma Analytics helps organizations streamline their operations while adhering to necessary compliance standards.
Capabilities Can Sigma Analytics facilitate self-service analytics for non-technical users?
Yes, Sigma Analytics is designed to facilitate self-service analytics for non-technical users, empowering them to access and analyze data independently. The platform's intuitive interface allows users without a technical background to create their own dashboards and generate insights quickly, significantly reducing reliance on IT departments. For instance, companies like Teachable and PowerToFly have reported substantial improvements in efficiency, with Teachable cutting ad-hoc data requests by over 70% and PowerToFly enabling non-technical teams to build dashboards in just one week. This self-service capability not only accelerates decision-making but also enhances productivity across various departments, allowing teams to focus on strategic initiatives rather than routine reporting tasks. Overall, Sigma Analytics democratizes data access, making it easier for all employees to leverage analytics in their roles.
Capabilities Can Sigma Analytics automate workflows for data reporting?
Yes, Sigma Analytics can automate workflows for data reporting, significantly enhancing efficiency and reducing manual effort. Users can easily set up recurring reports on a defined schedule, allowing teams to receive timely insights without the need for constant manual intervention. Sigma's platform enables data analysts to upload specific CSV files, create intermediary tables, and generate charts based on various data sources, streamlining the reporting process. This automation not only saves time—such as the 12 hours per week saved by Customer Success teams—but also empowers non-technical users to self-serve data and create dashboards independently. By minimizing reliance on IT and manual reporting, Sigma Analytics fosters a collaborative environment where teams can focus on data analysis rather than data assembly.
Capabilities Does Sigma Analytics allow for automated reporting and dashboard creation?
Yes, Sigma Analytics does allow for automated reporting and dashboard creation, making it a powerful tool for businesses looking to streamline their data processes. Users can easily set up recurring reports on a schedule, whether for themselves or their teams, which significantly reduces the time spent on manual reporting. Sigma's user-friendly interface enables teams to create dashboards quickly and efficiently, allowing for real-time analytics and self-service dashboard editing. This automation not only enhances collaboration among team members but also empowers non-technical users to access and analyze data directly, leading to faster insights and improved decision-making. Overall, Sigma Analytics simplifies the reporting process, enabling organizations to focus on leveraging data for strategic growth.
Capabilities Does Sigma Analytics allow for self-service analytics across different teams?
Yes, Sigma Analytics is designed to facilitate self-service analytics across different teams within an organization. By empowering non-technical users to access and analyze data directly, Sigma eliminates bottlenecks that often occur when only engineers or data specialists can handle analytics tasks. For instance, companies like Duolingo and PowerToFly have successfully utilized Sigma to enable broader access to data, resulting in significant increases in dashboard creation and faster decision-making processes. Teams can create their own insights and dashboards without needing engineering support, which not only improves productivity but also enhances collaboration across departments. This self-service capability allows organizations to respond more swiftly to business needs and fosters a data-driven culture.
Capabilities Can Sigma Analytics integrate with cloud data warehouses for seamless data management?
Yes, Sigma Analytics can seamlessly integrate with cloud data warehouses, particularly with Snowflake, to enhance data management capabilities. This integration allows users to access and analyze data in real-time without relying on IT, facilitating self-service analytics. For instance, companies like DoorDash and DataBank have successfully utilized Sigma with Snowflake to democratize data access, enabling non-technical staff to create dashboards and generate reports independently. This integration not only streamlines data workflows but also improves collaboration and decision-making across teams. By leveraging Sigma's user-friendly interface alongside cloud data warehouses, organizations can significantly reduce the time spent on manual reporting and ad-hoc requests, ultimately driving efficiency and business growth.
Use cases How can SDRs use Sigma Analytics to improve their lead tracking and reporting?
Sales Development Representatives (SDRs) can leverage Sigma Analytics to enhance their lead tracking and reporting by utilizing its user-friendly interface to create customized dashboards that visualize key metrics in real-time. By integrating Sigma with existing CRM systems like Salesforce or HubSpot, SDRs can access live data on lead interactions, conversion rates, and campaign performance without needing technical expertise. This allows them to quickly identify trends, optimize outreach strategies, and adjust their tactics based on data-driven insights. Additionally, the ability to automate reporting means SDRs can focus more on engaging with leads rather than spending time on manual data entry, ultimately improving their efficiency and effectiveness in lead management. With Sigma, SDRs can foster a data-driven culture that enhances collaboration and decision-making across the sales team.
Use cases What are the best use cases for Sigma Analytics in marketing teams looking to optimize campaign performance?
Sigma Analytics is particularly effective for marketing teams aiming to optimize campaign performance through several key use cases. First, it enables teams to create real-time dashboards that track sign-ups, conversions, and channel performance, allowing for immediate insights into which marketing channels drive growth. For instance, Clay utilized Sigma to transform scattered data into actionable insights, fostering a data-driven culture within the organization. Additionally, Sigma's capabilities allow non-technical staff to generate their own reports, enhancing collaboration and decision-making speed. Migo's marketing team leveraged Sigma to pivot their strategy in just 30 days, resulting in a 47% increase in recovery campaign response rates. Overall, Sigma empowers marketing teams to monitor campaign metrics effectively, optimize strategies, and improve customer experiences, ultimately driving better ROI on marketing spend.
Use cases In what scenarios should RevOps teams implement Sigma Analytics for better data governance and collaboration?
RevOps teams should implement Sigma Analytics in scenarios where data governance and collaboration are critical for operational efficiency and decision-making. For instance, when teams face challenges with fragmented reporting or slow access to data, Sigma's unified analytics platform can streamline data entry and analysis, allowing users to collaborate in real time. This is particularly beneficial for organizations like Duolingo and Migo, where Sigma enabled significant increases in user adoption and faster decision-making. Additionally, if a company struggles with high ad-hoc data requests or relies heavily on IT for reporting, Sigma can empower non-technical users to create their own dashboards and conduct analyses independently, thus enhancing data accessibility and governance. By leveraging Sigma, RevOps teams can ensure that sensitive information remains secure while promoting a data-driven culture across the organization.
Use cases How can sales leaders leverage Sigma Analytics to gain real-time insights into sales performance and team productivity?
Sales leaders can leverage Sigma Analytics to gain real-time insights into sales performance and team productivity by utilizing its cloud-native platform that allows for live data access and easy report creation. By enabling sales teams to self-serve their data needs, Sigma reduces reliance on IT and accelerates the reporting process, allowing leaders to track key performance indicators (KPIs) and sales metrics in real time. With Sigma's user-friendly interface, sales leaders can quickly create dashboards that visualize performance trends, monitor team productivity, and identify areas for improvement. Additionally, the ability to automate reports and share insights fosters collaboration among team members, ensuring that everyone is aligned and informed. This streamlined access to data ultimately enhances decision-making and drives better sales outcomes.
Use cases What workflows can benefit from using Sigma Analytics for data visualization in the education sector?
Sigma Analytics can significantly enhance various workflows in the education sector by streamlining data visualization and reporting processes. For instance, institutions can utilize Sigma to automate the creation of dashboards for tracking student performance and engagement metrics, allowing educators to make data-driven decisions quickly. Additionally, Sigma's user-friendly interface empowers non-technical staff to access and analyze data independently, reducing reliance on IT teams for routine reporting. This capability was evident at Teachable, where ad-hoc data requests were cut by over 70%, enabling faster insights and collaboration across departments. Furthermore, Sigma facilitates the rapid execution of A/B testing, as demonstrated by Duolingo, which now runs over 300 tests simultaneously, enhancing their ability to adapt to educational needs efficiently. Overall, Sigma Analytics fosters a data-centric culture that supports improved educational outcomes and operational efficiency.
Use cases What workflows can benefit from Sigma Analytics in the education sector to enhance data accessibility for non-technical staff?
Sigma Analytics can significantly enhance data accessibility for non-technical staff in the education sector by streamlining workflows such as dashboard creation, reporting, and data analysis. For instance, institutions like Teachable and Duolingo have leveraged Sigma to empower product managers and other non-technical users to build their own dashboards, reducing reliance on data teams and accelerating feedback loops. This self-service capability allows staff to quickly analyze student performance, track engagement metrics, and run A/B tests without needing extensive technical expertise. Additionally, Sigma's user-friendly interface facilitates the automation of routine reports, freeing up valuable time for educators and administrators to focus on strategic initiatives. By democratizing data access, Sigma fosters a culture of data-driven decision-making across educational organizations.
Use cases How does Sigma Analytics help marketing teams quickly pivot strategies based on real-time data analysis?
Sigma Analytics empowers marketing teams to swiftly pivot their strategies by providing instant access to real-time data analysis, enabling them to make informed decisions without relying on the BI team. With Sigma's user-friendly interface, non-technical users can create their own dashboards and reports, facilitating a collaborative environment where teams can explore data and derive insights in minutes. For instance, Migo's marketing team was able to adjust their strategy within 30 days, resulting in a 47% increase in recovery campaign response rates and an 11% improvement in ROI on marketing spend. By streamlining data access and automating reporting processes, Sigma enhances agility and responsiveness, allowing marketing teams to optimize campaigns and improve customer engagement effectively.
Use cases How did Migo's marketing team utilize Sigma Analytics to pivot their strategy and improve campaign response rates?
Migo's marketing team utilized Sigma Analytics to gain instant access to live data, enabling them to run analyses independently without relying on the BI team. This newfound capability allowed them to pivot their marketing strategy within just 30 days, leading to a significant 47% increase in recovery campaign response rates and an 11% improvement in ROI on marketing spend. By leveraging Sigma's cloud-native platform, the team collaborated on real-time data, facilitating faster decision-making and more effective campaign optimization. The ease of use and accessibility of Sigma Analytics empowered Migo's marketing team to adapt quickly to changing market conditions and enhance their overall marketing effectiveness.
Alternatives What are the key differences between Sigma Analytics and Domo?
Sigma Analytics and Domo are both powerful data analytics platforms, but they cater to different business needs and user experiences. Sigma Analytics focuses on providing a cloud-native platform that allows non-technical users to easily create dashboards and analyze data without relying heavily on IT, which enhances accessibility and speeds up decision-making. In contrast, Domo offers a more comprehensive suite of business intelligence tools, including advanced data visualization and collaboration features, but may require more technical expertise to fully leverage its capabilities. For example, JamLoop switched from Domo to Sigma to achieve faster reporting and improved data refresh rates, highlighting Sigma's flexibility and user-friendly interface. Ultimately, the choice between Sigma and Domo depends on your organization's specific requirements for data accessibility, reporting speed, and user expertise.
Alternatives How does Sigma Analytics compare to MicroStrategy in terms of features?
Sigma Analytics and MicroStrategy both offer robust analytics capabilities, but they cater to different user needs and experiences. Sigma Analytics is designed for ease of use, featuring a user-friendly interface that allows non-technical users to create dashboards and perform data analysis without extensive training. It excels in self-service analytics, enabling quick adjustments and real-time collaboration. In contrast, MicroStrategy is known for its powerful enterprise-level features, including advanced data visualization and extensive reporting capabilities, but it may require more technical expertise to navigate effectively. While Sigma focuses on simplifying the analytics process and enhancing accessibility, MicroStrategy provides deeper analytical tools suited for complex data environments. Ultimately, the choice between the two depends on the specific requirements of the organization, such as user expertise and the complexity of data analysis needed.
Alternatives What are the advantages of using Sigma Analytics over TIBCO Spotfire?
Sigma Analytics offers several advantages over TIBCO Spotfire, particularly in terms of user accessibility and speed of reporting. Sigma's intuitive, Excel-like interface empowers non-technical users to create their own dashboards and conduct analyses without relying heavily on IT support, which can significantly reduce the time spent on ad-hoc data requests. For instance, companies like Teachable have reported a 70% reduction in such requests, allowing their data teams to focus on more strategic initiatives. Additionally, Sigma provides faster data refresh rates, enabling real-time insights that enhance decision-making. In contrast, TIBCO Spotfire may require more technical expertise and can be less flexible in terms of user-driven analytics, making Sigma a more appealing choice for organizations looking to democratize data access and improve operational efficiency.
Alternatives What are the best alternatives to Sigma Analytics for data visualization?
When considering alternatives to Sigma Analytics for data visualization, several notable options stand out. Tableau is widely recognized for its powerful visualization capabilities and user-friendly interface, making it a popular choice among businesses. Power BI, developed by Microsoft, offers robust integration with other Microsoft products and is known for its affordability and ease of use. Looker, now part of Google Cloud, provides advanced analytics and data exploration features, ideal for organizations looking for in-depth insights. Additionally, Qlik Sense is praised for its associative data model, allowing users to explore data freely. Each of these tools has unique strengths, so the best choice will depend on your specific business needs, budget, and existing technology stack.
Alternatives How does Sigma Analytics stack up against Sisense for business intelligence?
When comparing Sigma Analytics and Sisense for business intelligence, both platforms offer robust features but cater to different user needs. Sigma Analytics excels in providing a user-friendly interface with strong data visualization capabilities, making it ideal for teams that prioritize ease of use and quick insights. It also emphasizes self-service analytics, allowing users to create reports without extensive technical knowledge. On the other hand, Sisense is known for its powerful data integration capabilities and advanced analytics features, which are beneficial for organizations dealing with large datasets and complex queries. Sisense's strength lies in its ability to handle big data and provide in-depth analytics, making it suitable for data-heavy enterprises. Ultimately, the choice between Sigma Analytics and Sisense will depend on your organization's specific requirements, such as ease of use versus advanced analytical capabilities.
Alternatives What makes Sigma Analytics a better choice than Domo for data analysis?
Sigma Analytics is often considered a better choice than Domo for data analysis due to its user-friendly interface that empowers non-technical users to access and analyze data independently. This accessibility has led to significant increases in dashboard creators and reduced reliance on data teams for routine reporting, as seen in companies like Teachable, which cut ad-hoc requests by over 70%. Additionally, Sigma offers faster data refresh rates, improving from Domo's 12–18 hours to just 2 hours, enabling real-time insights that enhance decision-making. The cloud-native platform also allows for live demos of dashboards, which can boost customer acquisition, as demonstrated by JamLoop's 120% growth in new customers after switching. Overall, Sigma's focus on flexibility, speed, and ease of use makes it a compelling alternative to Domo for organizations seeking efficient data analysis solutions.
Who uses Sigma: customer base, geography, and industries
Among the 115 customers we looked at, adoption is concentrated in North America, which accounts for 86 of the 98 customers where region is known. Enterprise companies make up the largest segment (48 of 101 where segment is known), followed by Mid-Market and SMB. Industry is spread across a range of sectors, with Diversified Financial Services leading, and representative customers including Affirm, AB CarVal, and AgencyKPI. Sigma Computing® itself markets to Financial Services, Healthcare, Retail & CPG, Manufacturing, Insurance. Industry analysts place its strongest presence in finance, sales.
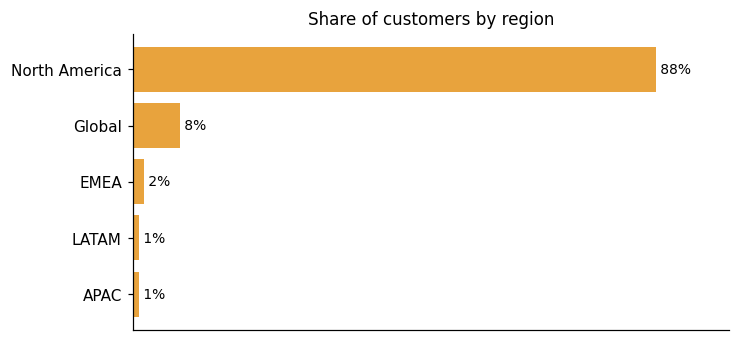
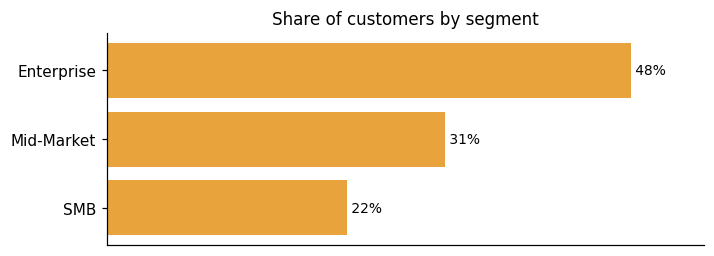
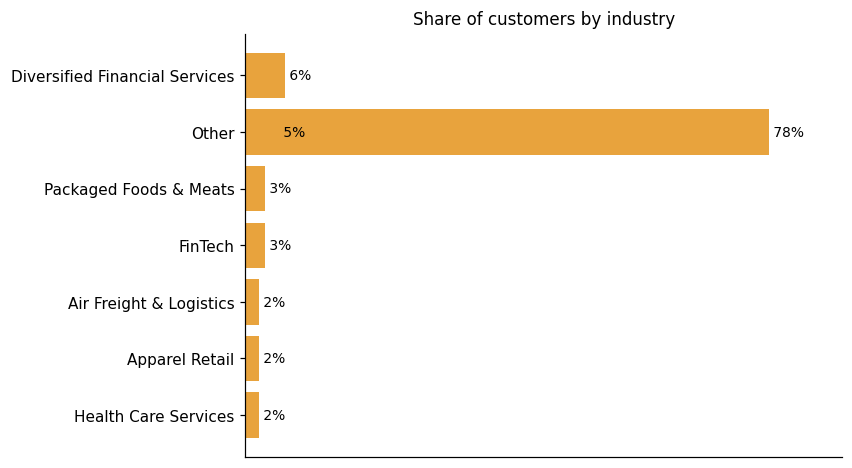
Representative customers: (1001-5000 employees), (5001-10,000 employees), (501-1000 employees), (51-200 employees), AB CarVal, Affirm, AgencyKPI
How Sigma uses AI in practice
Sigma® brings AI into several distinct parts of its cloud data warehouse analytics platform. The AI-powered features include natural language querying, LLM-enriched spreadsheet columns, and AI app generation. Sigma also supports agentic building to automated analysis and external triggers through Sigma Assistant. That last capability is positioned by the vendor as "agentic," meaning Sigma Assistant is described as guiding users through building and analysis with a degree of autonomous action. At the same time, the core BI, spreadsheet, and SQL analytics value in Sigma exists independently of these AI features. Fully transparent answers grounded in IT-approved semantic models are available through natural language exploration, keeping results tied to governed data. AI can also be used to simplify the design process and embed advanced logic into your UI when building applications.
Generative AI
Read detailsSigma's Generative AI capability covers three distinct areas: natural language querying, AI-enriched spreadsheet columns, and prompt-driven dashboard creation — all running directly on the warehouse. Ask Sigma handles the natural language querying. AI Query enriches spreadsheet columns using large language models. AI Builder takes plain-language prompts and converts them into fully wired dashboards and applications.
Agentic AI
Read detailsSigma Agents run directly on warehouse compute and can act without human intervention — detecting conditions, reasoning over business logic, and carrying out multi-step actions that include warehouse writebacks, REST API calls, and webhooks. Integrations cover Salesforce, Jira, and Slack. The vendor describes three operating modes: interactive, autonomous, and external-action.
Sigma pricing and value: what the evidence shows
Sigma® delivers measurable time savings for analytics teams, with customers reporting that moving from traditional BI tools to Sigma brought analysis time down from days to hours. Thirty customers have reported ROI results from using the platform. Pricing is not published on Sigma's website, so buyers will need to engage the vendor directly for a quote. On the capability side, one customer describes the potential this way: "Ask Sigma could be the bridge that helps our users leave legacy tools behind and build live, scalable processes." Another puts the broader impact plainly: "Technological barriers have been removed from the picture, and that was the goal of this project."
ROI evidence from 30 customers
- the move from the traditional BI tools to Sigma brought down the analysis time from days to hours, resulting in significant time savings
- In time savings
- Sigma presents a great way for our customers to explore our data assets with rich visualizations and, for many, immediately delivers ROI.
- being able to take that unstructured data from brand teams and create views or procedures off of input tables has saved us a lot of pain moving forward
Time-to-value: what implementations take
- There was no two or three-week onboarding period – or needing to meet with multiple people to get all of these different moving pieces together.
- 5X as many people have created top 20 dashboards (by usage over the past 90 days) in Sigma since migrating from Looker
- TrovaTrip is able to onboard users in Sigma in just two weeks, 92% faster than the usual six months.
- 92% reduction in report builder onboarding time, down from 6 months to 2 weeks
- 1 analyst | Migrated entire BI stack in 1 month
Who it fits: value by company size
Cost and headcount pressures show up across the customer evidence here. One team was constrained by a previous BI solution to 30-40 licenses because of cost, specifically because paying the same per-seat rate for occasional users was not sustainable — a signal that organizations watching their license spend will feel this tension with seat-based pricing generally. Sigma addressed that for them, but the concern about per-seat economics is worth examining during evaluation. On the efficiency side, a team of five can now be replaced by one person for tasks that historically required the full group. Another customer built more than 30 standard reports in a couple of months without adding headcount. And one organization reduced overall spend, headcount, and time wasted during a difficult global financial downturn. One negative signal to note: a single customer reports that copying and pasting data out of a table is available to any user, but getting an export button requires a higher license tier. That is one customer's account, not a pattern across multiple reports, but it is a functional limitation tied to licensing that buying teams should verify during a trial or demo.
No dedicated pricing page detected; pricing is undisclosed on the vendor site.
Sigma enterprise readiness: security, compliance, and migration
Sigma® covers enterprise readiness across three dimensions: security, compliance, and migration. These areas reflect how Sigma Computing® addresses governance and operational requirements for Analytics and Business Intelligence Platforms buyers.
Security controls and assurance
Sigma's security posture is built around a zero-copy architecture that eliminates a common enterprise pain point: duplicate permission models. Rather than extracting data and re-enforcing access rules inside the BI layer, Sigma passes the authenticated user's identity directly to the warehouse via OAuth passthrough, so row-level and column-level security policies are inherited natively, not re-implemented. The agent physically cannot reason over data the executing user is restricted from viewing — there is nothing to misconfigure. Every write executed through the Sigma Actions framework follows the same model: all operations inherit existing row-level and column-level security policies, and every action lands in the warehouse's own audit trail, giving compliance teams an immutable record. Network traffic can be kept entirely off the public internet as well — Sigma supports AWS PrivateLink, Azure Private Link, and GCP Private Service Connect for private backbone connectivity. On the certification side, Sigma holds ISO 27001 and SOC 1, along with SOC 2 Type II, SOC 3, and a TruSight Assessment — a set of attestations that typically satisfies procurement gatekeepers in regulated industries.
Compliance and data protection
Sigma's compliance posture covers three major regulatory frameworks: it complies with CCPA, GDPR, and HIPAA. For healthcare buyers, Sigma addresses HIPAA requirements by design — clinical teams can query live data without moving PHI out of the cloud data warehouse, so protected health information never travels to a separate reporting layer. For regulated industries such as financial services, Sigma supports automated regulatory compliance with lineage, replacing manual reporting and static extracts with governed workflows. Audit, risk, and operations teams can trace every figure back to its source in a single collaborative environment. The platform's calculation transparency goes further: every formula and transformation is inspectable at the cell level, and Sigma surfaces the exact SQL sent to the warehouse, allowing regulated firms to demonstrate data lineage, reproducibility, and access history to both internal model risk teams and external regulators.
Migration from competing platforms
Migrate from Tableau to Sigma with Hakkōda AI
Sigma vs. Google, Microsoft, Oracle and other platforms
Analytics and Business Intelligence Platforms are software tools that help organizations model, analyze, and visualize data to support informed decision-making. They typically cover data preparation, interactive dashboards, reports, and visualizations, pulling from multiple sources to give users a unified view and the ability to clean and transform data. Sigma competes in this category, and embedded analytics is one area where it stands out. Sigma enables embedding of dashboards, charts, and reports in internal business applications, SaaS apps, and public websites, with end-user personalization included.
Analytics and Business Intelligence Platforms
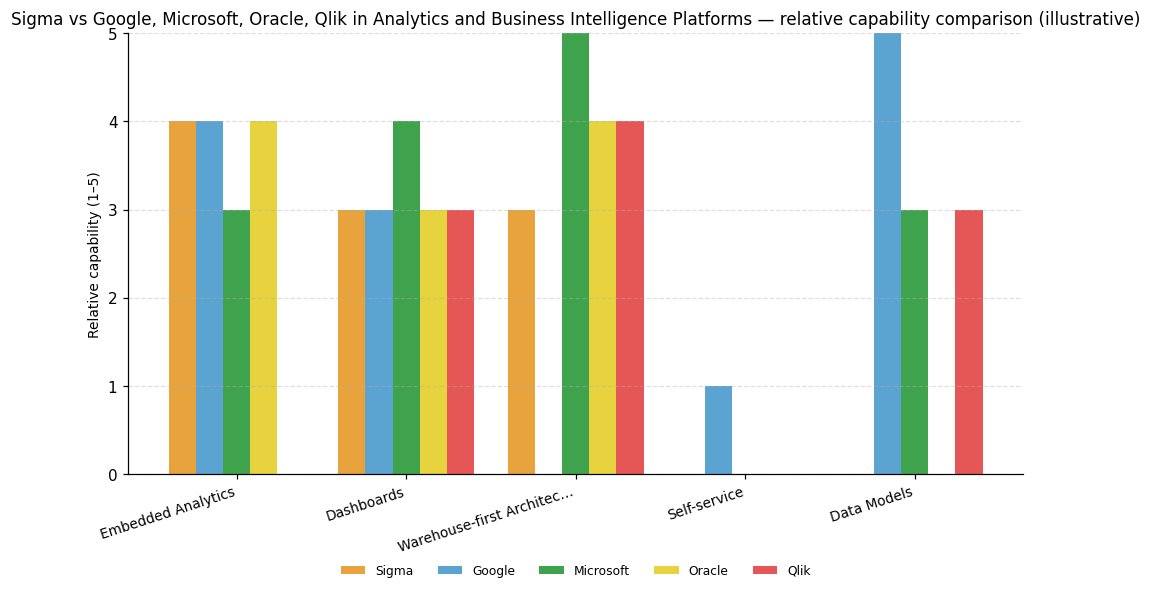
| Capability | Sigma | Microsoft | Oracle | Qlik | |
|---|---|---|---|---|---|
| Embedded Analytics | 4 | 4 | 3 | 4 | — |
| Dashboards | 3 | 3 | 4 | 3 | 3 |
| Warehouse-first Architecture | 3 | — | 5 | 4 | 4 |
| Self-service | — | 1 | — | — | — |
| Data Models | — | 5 | 3 | — | 3 |
Sigma®
Embedded Analytics: Enables embedding of dashboards, charts and reports in internal business applications, SaaS apps and public websites with end-user personalization, rated strong.
Embedded Analytics: Allows integration of interactive visualizations and data experiences directly into any application for users and prospects, rated strong.; Data Models: API-first open semantic layer acts as a single source of truth guaranteeing data accuracy, consistency and governance, enabling deep integration with other platforms, rated strong and the standout in this set.
Microsoft
Dashboards: Dominant market presence makes finding skills, consultants and training material easier than peers, supporting strong visualization adoption, rated strong.; Warehouse-first Architecture: Power BI is part of Microsoft Fabric encompassing OneLake, Data Integration, Data Warehouse, Apache Spark, Data Science and operational databases, rated strong and the broadest ecosystem in this set.
Oracle
Embedded Analytics: Content is embedded in business application workflows to support data-driven decisions, rated strong.; Warehouse-first Architecture: Integration with Fusion Data Intelligence provides packaged data integration and models for horizontal functions, rated strong but scoped primarily to Oracle ecosystem users.
Qlik
Warehouse-first Architecture: Offered as a service across all major clouds and integrates with many major enterprise cloud applications, rated strong.


Connect Sigma with your stack: integrations and partner ecosystem
Sigma® connects to a wide range of tools through both native integrations and partnership arrangements, spanning areas like cloud networking, relational databases, and CRM.
Sigma's integration story spans agentic API actions, embedding via REST API, and white-label embed capabilities. Sigma Agents call external APIs and can take action — creating Salesforce opportunities, posting Slack or Teams alerts, triggering Zendesk tickets, or writing enriched rows back to your warehouse. On the embedding side, Sigma uses an iFrame with a server-side API secured by JSON web token (JWT) security. A REST API and ready-made API recipes cover common tasks like onboarding new users and listing workbooks to build custom menus. Embedding Sigma can be completed within a day on average. For teams that need full control over presentation, Sigma supports white-label, live query embeds with interactive dashboards, writeback capabilities, and APIs. A native embed sandbox and quickstarts help development teams move quickly from setup to deployment.
| Partner category | Integration partners | Native count | Flow direction |
|---|---|---|---|
| cloud networking / private connectivity | AWS PrivateLink, Azure Private Link | 1 | Upstream |
| relational database | Microsoft SQL Server, PostgreSQL | 1 | Upstream |
| CRM | Salesforce | 1 | Bidirectional |
| CRM / marketing automation | HubSpot | 0 | Upstream |
| business messaging / collaboration | Slack | 0 | Downstream |
| cloud database | Google AlloyDB | 0 | Upstream |
| data warehouse | Snowflake | 0 | Upstream |
| AI / large language model provider | Anthropic | 1 | Upstream |
| Analytics Consulting | Analytics8, Montreal Analytics | 0 | Unknown |
| Cloud Consulting | AllCloud, CloudEQS, Hakkoda, Ollion, Onebridge, SADA Systems | 0 | Unknown |
| Data Consulting | Brooklyn Data Co., Data Culture, Data Ideology, Data Solutions Consulting, Datateer, Infostrux, Koantek, Wavicle Data Solutions | 0 | Unknown |
| Data Integration | Alooma, Matillion, Stitch | 0 | Unknown |
| Data Quality & Observability | Elementary | 0 | Unknown |
| ELT / data integration | Fivetran | 0 | Upstream |
| ERP / financial management | NetSuite | 0 | Upstream |
| IT Staffing | Apex Systems LLC | 0 | Unknown |
| Management Consulting | Archetype, Slalom, Spaulding Ridge | 0 | Unknown |
| Other | 829 Studios, Aptitive, DataOps, GJH INC, GrowthBench, HyperFinity, Mammoth Growth, Monte Carlos Consulting, North Labs, Peraison, SG:certified, kipi.ai, kipi.bi | 0 | Unknown |
| Sales Intelligence | LeadIQ | 0 | Unknown |
| Venture Capital | Avenir Growth Capital | 0 | Unknown |
| Virtualization & Remote Access | Citrix Systems | 0 | Unknown |
| customer service / support platform | Zendesk | 1 | Bidirectional |
| data activation / reverse ETL | Census, Hightouch | 1 | Downstream |
| data analytics consulting | Data Clymer, phData | 0 | Unknown |
| data catalog | Castor | 1 | Upstream |
| data catalog / active metadata platform | Atlan | 0 | Upstream |
| data catalog / data intelligence | Alation | 0 | Upstream |
| data catalog / data management | Secoda | 1 | Upstream |
| data catalog / knowledge graph | data.world | 0 | Upstream |
| data discovery / data catalog | Select Star | 0 | Upstream |
| data lakehouse / SQL analytics engine | Starburst | 1 | Upstream |
| data lakehouse platform | Databricks | 0 | Upstream |
| data observability | Metaplane, Monte Carlo | 0 | Upstream |
| data transformation | dbt Labs | 0 | Upstream |
| project management / issue tracking | Jira | 1 | Downstream |
What's new in Sigma
Sigma® has logged 2 product updates in the last 9 months within the Analytics and Business Intelligence Platforms space. No awards have been recorded for Sigma in the last 24 months.
December 2025 Product Launch
Sigma's December 2025 quarterly product launch covers AI, apps, and governance, framed around the theme of navigating AI Country.
Read more →September 2025 Product Launch
Sigma's September 2025 quarterly product launch brings updates across AI workflows, apps, and analytics innovations in one release.
Read more →Sigma Launches New Process Effectiveness Solution with Snowflake to Power AI-Driven Energy Operations | Sigma
Sigma Computing and Snowflake have launched a new process effectiveness solution aimed at enhancing AI-driven operations in the energy sector. This collaboration provides a unified data foundation, enabling energy companies to optimize yield, improve operational resilience, and reduce emissions by integrating IT, OT, and IoT data. The solution supports real-time market-aware operations and democratizes expert analysis, allowing for more efficient and secure energy infrastructure.
Sigma Expands into APJ, Appoints New Leadership to Drive Growth and Innovation | Sigma
Sigma has expanded into the Asia Pacific and Japan (APJ) region, opening a new headquarters in Sydney and appointing Bede Hackney as Vice President for the region. Hackney, with extensive experience in AI and data technologies, will focus on driving growth and customer success. This move aims to capitalize on the growing demand for AI-driven solutions in APJ.
Sigma Expands into APJ, Appoints New Leadership to Drive Growth and Innovation - PA Media
Sigma Computing expands into the Asia-Pacific and Japan (APJ) region, appointing new leadership to drive growth and innovation in the area.
Sigma Computing, Inc. Profile
Company Name
Sigma Computing, Inc.
Company Website
https://www.sigmacomputing.com/HQ Location
90 New Montgomery St, San Francisco, California 94105, US
Employees
11-50
Social


Financials
SERIES B