Comparison Summary
This comparison report of IntouchSurvey vs. Spark Chart is based on a specific set of business needs and context. The comparison uses 1259 Cuspera insights based on peer reviews, case studies, testimonials, and expert opinions across 50+ sources.
Introducing IntouchSurvey and Spark Chart
IntouchSurvey, and Spark Chart belong to a category of solutions that help Customer Feedback Management. Different products excel in different areas, so the best platform for your business will depend on your specific needs and requirements.
IntouchSurvey covers Collecting Feedback with Mobile, Helpdesk Management with Phone Calls, Engaging Conversational Surveys with Offline, Event Management with Mobile, etc.
Spark Chart focuses on Collecting Feedback with Promotions, Social Media Management with Social Media, Training & Onboarding, Market Research with Promotions, etc.
"Intouch continues to be a trusted and valued partner at Parkland. The actionable data provided by the mystery shopping and age verification programs helps us understand our customer experience standards and identify areas for growth and training. " - Andrew B
"We are now working with clients we would otherwise not be able to help. Spark chart is very flexible and every aspect of the survey is customisable. The reports are high-quality, filtered easily, present beautifully and can be shared. And it manages... to do this while still being easy to use. Most of the work is done for you by the system. " - Dylan F
Unsure which of these solutions is right for you? Our Cuspera AI engine can compare them based on your needs and specific to your industry and context. Get your personalized report today.


About
Effortlessly capture customer insights to drive growth
Survey Software to uncover hidden knowledge & ideas
Financials
IPO
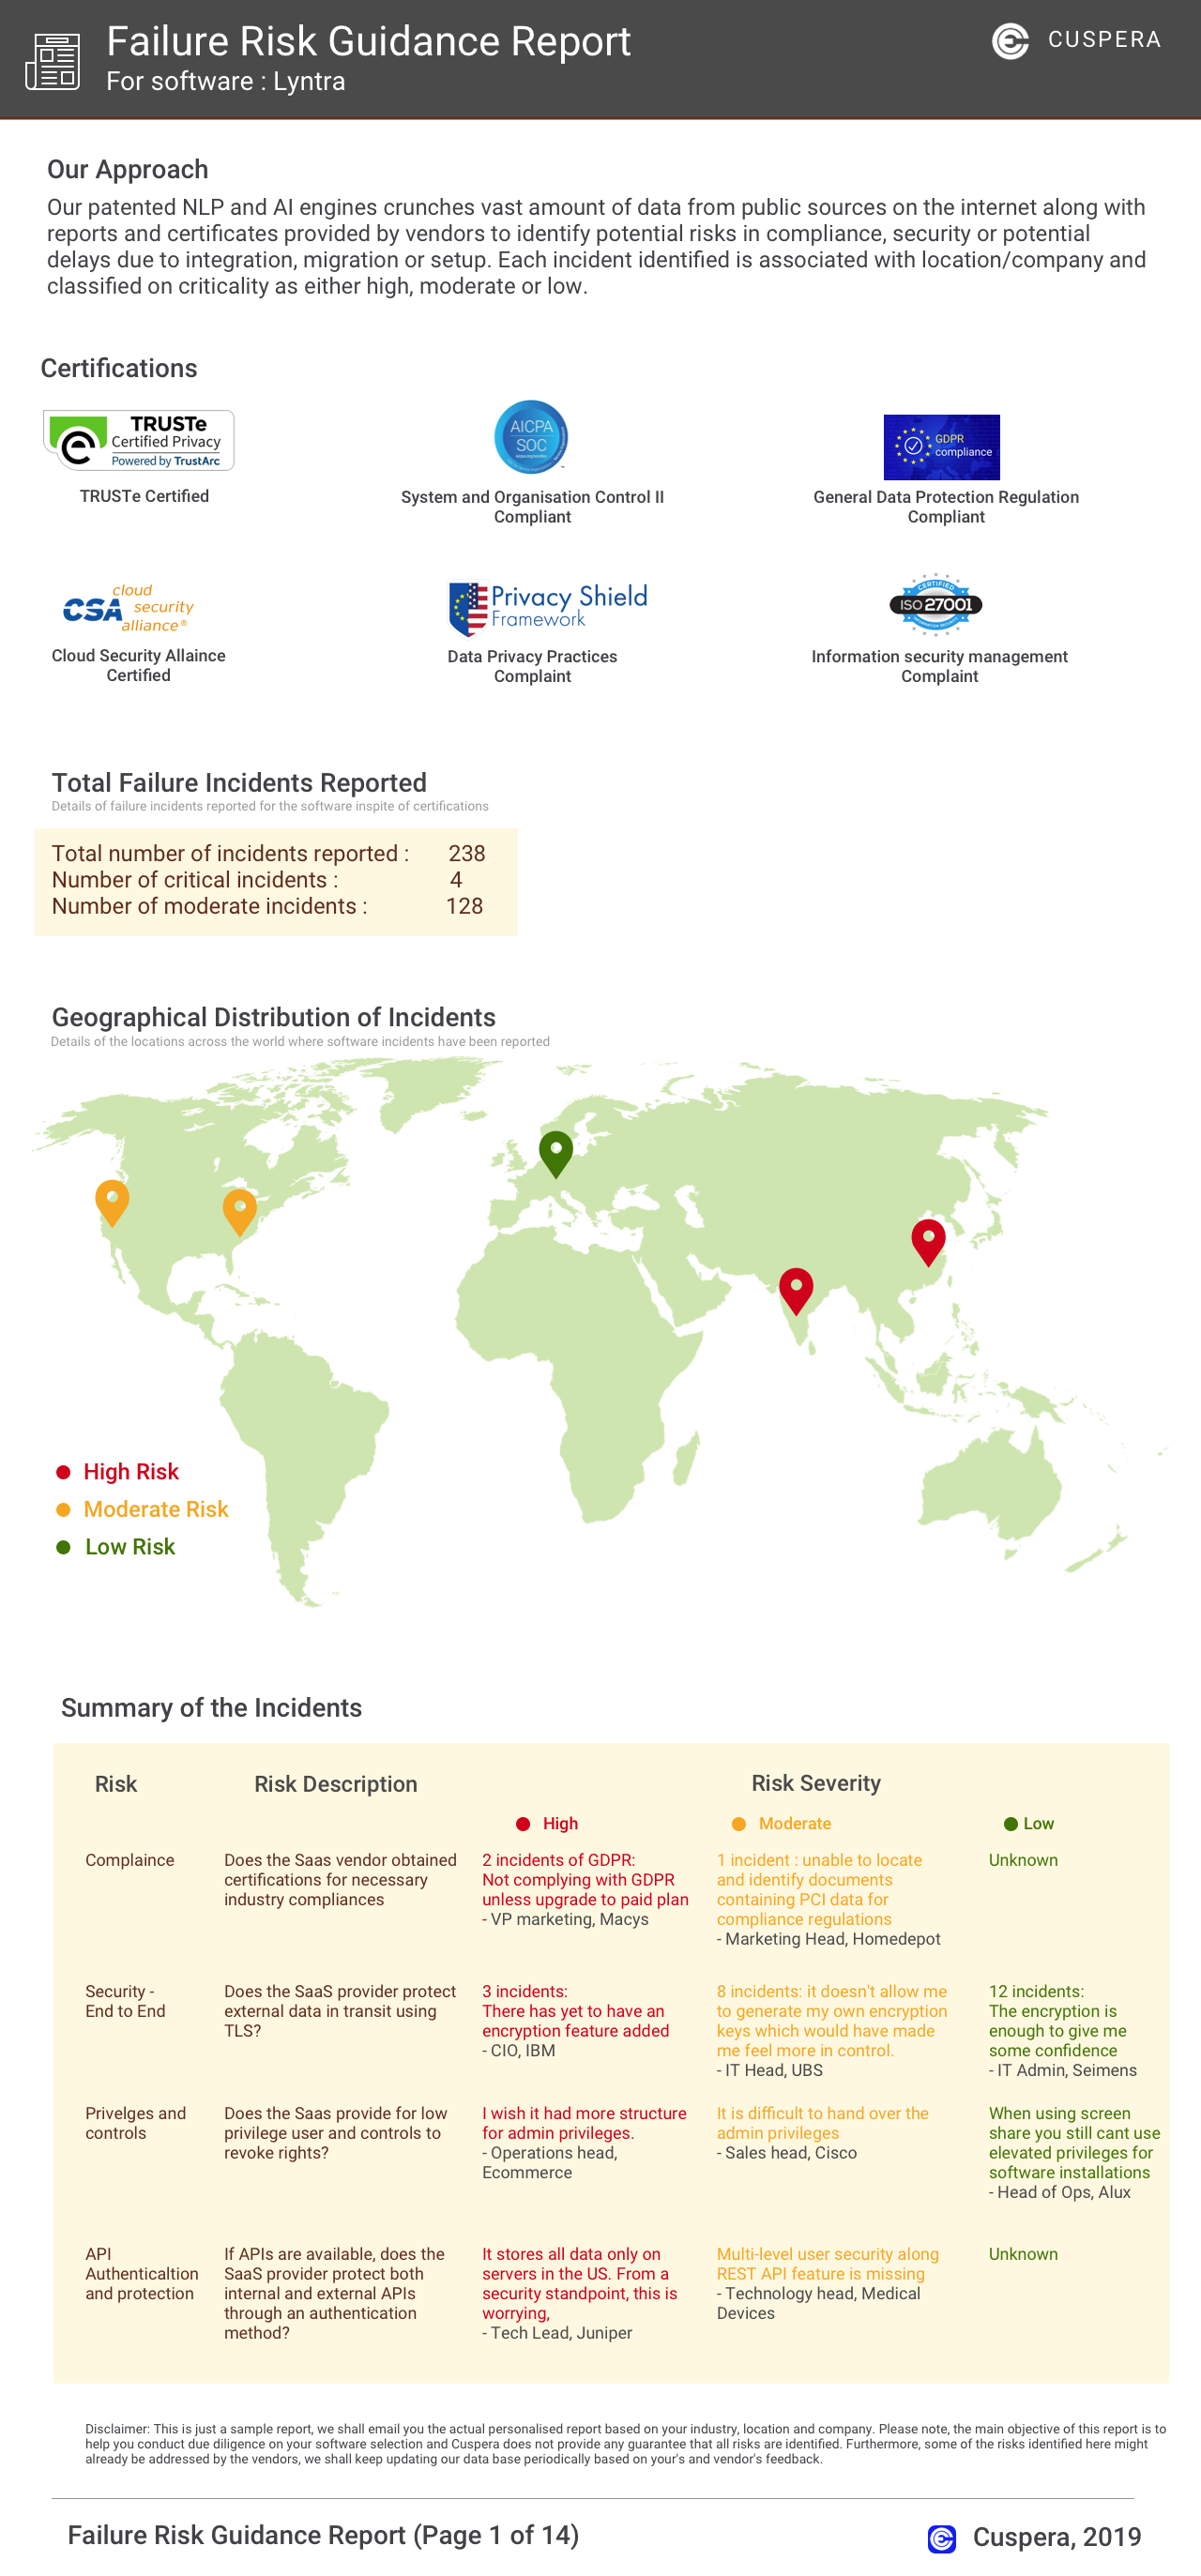
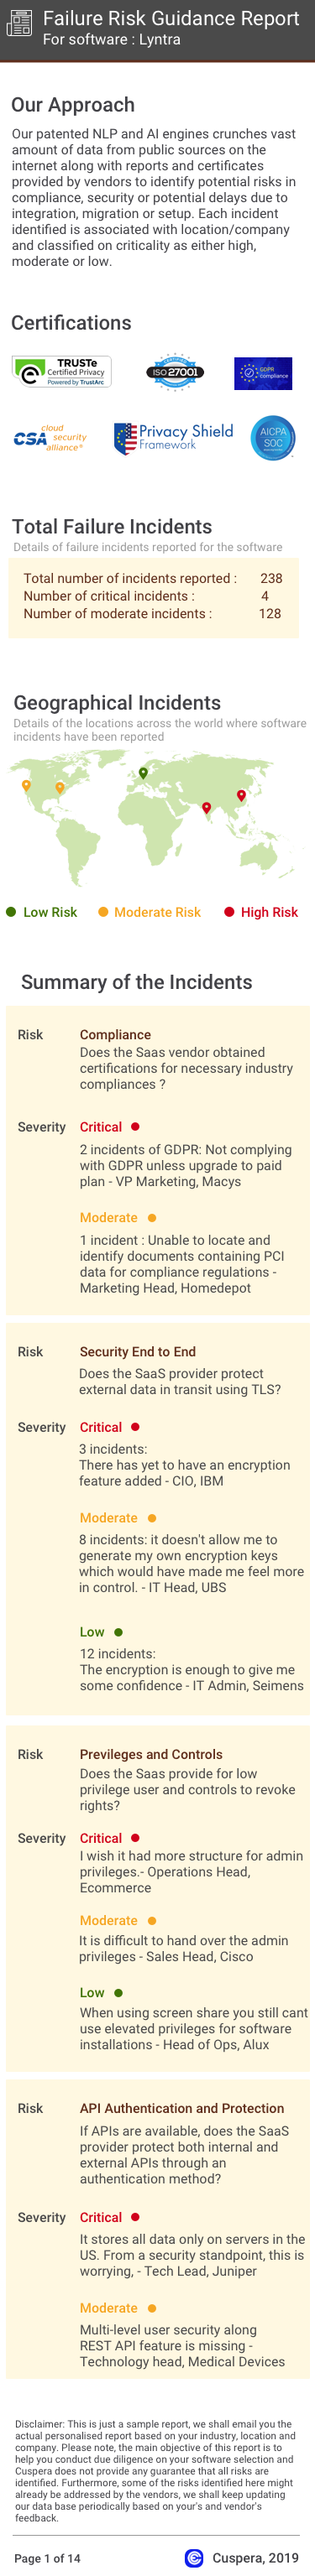
Business Need
Total Processes
(we found evidences for)
23
29
Total Goals
(we found evidences for)
10
5
Top Processes
Evidences indicate better relative satisfaction
Top Goals
Goals Achieved
-
Enhance customer relationships
-
Acquire customers
-
Scale best practices
-
Improve brand engagement
-
Increase average basket value
-
Improve efficiency
-
Build brand awareness
-
Improve digital and social presence
-
Improve ROI
-
Launch new products
- See 7 more
-
Enhance customer relationships
-
Acquire customers
-
Build brand awareness
-
Improve efficiency
-
Improve internal communications
- See 2 more
Top Channels
Channels Used
-
promotions
-
social media
-
e-mail
-
website
-
text SMS
-
phone calls
-
Facebook
- See 4 more
-
promotions
-
social media
-
e-mail
-
website
-
text SMS
-
phone calls
-
Facebook
- See 4 more
Failure Risk Guidance Security Report?
Compliance Risk
{{{rsh_C_1}}}
{{{rsh_C_1}}}
Security & Privacy Risk
{{{rsh_C_1}}}
{{{rsh_C_1}}}
Integration Risk
{{{rsh_C_1}}}
{{{rsh_C_1}}}
Migration Risk
{{{rsh_C_1}}}
{{{rsh_C_1}}}
IT and Other Capabilities
- Low
- Medium
- High