


InfoCaptor Overview
InfoCaptor offers a dynamic approach to business intelligence, enabling users to transform raw data into actionable insights. The software's unique selling point lies in its ability to clarify complex data, akin to sharpening a grainy image of your business. InfoCaptor's drag-and-drop visual reports creator simplifies the process of building dashboards, making it accessible for users without extensive technical expertise. It supports various databases, including SQL and MySQL, and integrates seamlessly with platforms like WooCommerce. This versatility allows businesses across industries, including healthcare, to tailor dashboards to their specific needs. InfoCaptor's capability to present data from multiple angles helps organizations uncover hidden patterns and trends, providing a competitive edge in decision-making.
Use Cases
Customers recommend Competitive Intelligence, Social Media Analytics, Funnel Analysis, as the business use cases that they have been most satisfied with while using InfoCaptor.
Business Priorities
Enhance Customer Relationships and Improve Consistency are the most popular business priorities that customers and associates have achieved using InfoCaptor.
InfoCaptor Use-Cases and Business Priorities: Customer Satisfaction Data
InfoCaptor's features include Dashboard, and Widgets. and InfoCaptor support capabilities include 24/7 Support, Chat Support, AI Powered, etc. also InfoCaptor analytics capabilities include Analytics, and Custom Reports.
Reviews
"My organization was looking for a way to chart MyQSL data on our website. One of the requirements was to use something that didn’t require extensive coding or multiple js files to run. InfoCaptor fit the bill. The programmer interface is similar to ...Microsoft’s Power BI and is quite easy to navigate once you get the hang of it. With that said, where InfoCaptor really shines is it’s commitment and support for their customers. The customer support team walked me through the installation and configuration of the product, and was critical in helping me code some of our trickier SQL scripts. They saved the day on more than one occasion. Our new site will launch in a few months and InfoCaptor charts will be a major component. We couldn’t be happy with our decision to become a client." - Terence H
Peer review evidence (same sources as the product rating summary)
"...Dashboard Software - Data Reporting Tool - Business Intelligence Online - InfoCaptor BI...." Business Intelligence Online
"...Martin Butler, Butler Analytics Data Dashboard Software - Drag and drop visual Reports Creator. ..." Business Intelligence Online
"...InfoCaptor provides the freedom to let you explore your data sets and provides a beautiful visual analysis tool...." Business Intelligence Online
InfoCaptor, Hevo, Skyvia Platform, Phocas, ZAP Data Hub, etc., all belong to a category of solutions that help Business Intelligence. Each of them excels in different abilities. Therefore, determining the best platform for your business will depend on your specific needs and requirements.
Infocaptor provides a comprehensive dashboard and data reporting tool for business intelligence. Users can examine data from multiple perspectives to achieve clarity and insights.
InfoCaptor Customer wins, Customer success stories, Case studies
How does InfoCaptor facilitate Competitive Intelligence?
Why is InfoCaptor the best choice for Funnel Analysis?
| CUSTOMERS | TESTIMONIALS |
|---|---|

|
My organization was looking for a way to chart MyQSL data on our website. One of the requirements was to use something that didn’t require extensive coding or multiple js files to run. InfoCaptor fit the bill. The programmer interface is similar to Microsoft’s Power BI and is quite easy to navigate... once you get the hang of it. With that said, where InfoCaptor really shines is it’s commitment and support for their customers. The customer support team walked me through the installation and configuration of the product, and was critical in helping me code some of our trickier SQL scripts. They saved the day on more than one occasion. Our new site will launch in a few months and InfoCaptor charts will be a major component. We couldn’t be happy with our decision to become a client. |
|
|
Wow, This BI Dashboard tool has amazing capabilities! This tool has amazing capabilities and can analyze from simple spreadsheets to complex data sources with ease and that too in your browser. I can stitch several spreadsheets with ease by just copy pasting the required elements and analyze furthe...r.Visualizations are amazing. Great product for non enterprise users too! |
|
|
Before InfoCaptor I had to manually paste up reports each time I wanted to see how my sales staff was trending against goals and last year’s sales. Now I have a realtime dashboard that lets me know who is performing and who is not. That allows me to be more proactive. Testimonial By Toby W |
| CUSTOMERS | TESTIMONIALS |
|---|---|
|
Terence H Director of Information Systems U.S. Wheat Associates |
My organization was looking for a way to chart MyQSL data on our website. One of the requirements was to use something that didn’t require extensive coding or multiple js files to run. InfoCaptor fit the bill. The programmer interface is similar to Microsoft’s Power BI and is quite easy to navigate... once you get the hang of it. With that said, where InfoCaptor really shines is it’s commitment and support for their customers. The customer support team walked me through the installation and configuration of the product, and was critical in helping me code some of our trickier SQL scripts. They saved the day on more than one occasion. Our new site will launch in a few months and InfoCaptor charts will be a major component. We couldn’t be happy with our decision to become a client. |
|
Parag K BI Manager Accenture |
Wow, This BI Dashboard tool has amazing capabilities! This tool has amazing capabilities and can analyze from simple spreadsheets to complex data sources with ease and that too in your browser. I can stitch several spreadsheets with ease by just copy pasting the required elements and analyze furthe...r.Visualizations are amazing. Great product for non enterprise users too! |
|
Toby W CEO/Presidentu Standard Filter Corporation |
Before InfoCaptor I had to manually paste up reports each time I wanted to see how my sales staff was trending against goals and last year’s sales. Now I have a realtime dashboard that lets me know who is performing and who is not. That allows me to be more proactive. Testimonial By Toby W |
Frequently Asked Questions (FAQ)
What buyers ask before choosing InfoCaptor
Integrations What CRM integrations are available with InfoCaptor?
InfoCaptor offers robust integration capabilities with several popular CRM platforms, enhancing its functionality for users looking to streamline their data reporting and analytics processes. Notably, InfoCaptor features a dedicated Salesforce connector, which simplifies the export of data into MySQL database tables, allowing users to create visually appealing dashboards and automated reports. This integration enables businesses to leverage their Salesforce data effectively, providing insights that can drive decision-making. Additionally, while specific CRM integrations beyond Salesforce are not detailed in the provided context, InfoCaptor's flexibility suggests that it can connect with various other CRM systems, making it a versatile choice for organizations seeking tailored business intelligence solutions.
Integrations How does InfoCaptor connect to Salesforce for data reporting?
InfoCaptor connects to Salesforce for data reporting through its dedicated Salesforce connector, which simplifies the process of exporting data into MySQL database tables. This integration allows users to seamlessly pull data from Salesforce, enabling them to create dynamic visualizations and automated dashboards without extensive coding. Once the data is in MySQL, InfoCaptor provides powerful tools for reporting and analytics, allowing businesses to generate insightful dashboards that can be shared with users and clients. This streamlined approach not only enhances data accessibility but also empowers organizations to make data-driven decisions efficiently, leveraging the robust capabilities of both Salesforce and InfoCaptor for comprehensive business intelligence.
Integrations Can I integrate InfoCaptor with HubSpot for analytics purposes?
Yes, you can integrate InfoCaptor with HubSpot for analytics purposes, allowing you to leverage the powerful data visualization and reporting capabilities of InfoCaptor alongside HubSpot's robust marketing and sales tools. This integration enables you to pull data from HubSpot, such as lead generation metrics, campaign performance, and customer interactions, into InfoCaptor's dashboards for comprehensive analysis. By visualizing this data, you can gain deeper insights into your marketing effectiveness and customer engagement, facilitating better decision-making. To set up the integration, you would typically use HubSpot's API to connect with InfoCaptor, ensuring that your data flows seamlessly between the two platforms. This integration can significantly enhance your analytics capabilities, helping you to optimize your marketing strategies based on solid data insights.
Integrations What are the setup steps for connecting InfoCaptor to Dynamics 365?
To connect InfoCaptor to Dynamics 365, start by ensuring you have the necessary credentials for your Dynamics 365 account, including the API endpoint, client ID, and client secret. Next, log into your InfoCaptor dashboard and navigate to the data source configuration section. Select "Add New Data Source" and choose Dynamics 365 from the list of available integrations. Enter the required credentials and configure the connection settings, ensuring that you specify the correct API endpoint. Once the connection is established, you can begin to create reports and dashboards using data from Dynamics 365. Finally, test the connection to ensure data is flowing correctly, and consult the InfoCaptor documentation for any troubleshooting tips if needed.
Integrations How does data flow between InfoCaptor and MySQL databases?
Data flows between InfoCaptor and MySQL databases through a seamless integration process that allows users to connect and extract data efficiently. To initiate this connection, users can configure InfoCaptor to access their MySQL database by providing the necessary credentials, such as the database name, username, and password. Once connected, InfoCaptor can pull data directly from MySQL tables, enabling users to create interactive dashboards and visualizations based on real-time data. Users can also perform SQL queries to manipulate and analyze the data, allowing for deeper insights into business performance. This integration not only streamlines data management but also enhances reporting capabilities, making it easier for businesses to visualize trends and make informed decisions based on their MySQL data.
Integrations Are there any limitations when integrating InfoCaptor with third-party data providers?
When integrating InfoCaptor with third-party data providers, there are some limitations to consider. While InfoCaptor is designed to facilitate seamless connections with various data sources, the complexity of the integration can vary depending on the specific provider and the data format. Users may encounter challenges related to data compatibility, especially if the third-party provider uses proprietary formats or requires extensive coding for API access. Additionally, while InfoCaptor supports a range of integrations, the level of support and documentation available for each integration can differ, which may impact the ease of setup. However, InfoCaptor's strong customer support team is available to assist with these challenges, ensuring users can effectively leverage their data for analytics and visualization.
Features What does InfoCaptor's SQL Dashboard do?
InfoCaptor's SQL Dashboard is a powerful tool designed to facilitate data visualization and analysis directly from various databases, such as MySQL, PostgreSQL, and Oracle. It allows users to create interactive dashboards by either manually writing SQL queries or utilizing a user-friendly drag-and-drop interface to select dimensions and metrics. This flexibility enables users, regardless of their SQL expertise, to build comprehensive analyses and publish them as online dashboards with ease. The SQL Dashboard enhances business intelligence by providing insights into performance metrics, customer trends, and other critical data points, ultimately helping organizations make informed decisions based on real-time data analysis.
Features How do I connect InfoCaptor to my MySQL database?
To connect InfoCaptor to your MySQL database, start by ensuring you have the necessary credentials, including the database hostname, username, password, and database name. First, launch InfoCaptor and navigate to the data source configuration section. Select MySQL as your database type and enter the required connection details. If you are using XAMPP, ensure that the MySQL service is running. After entering the credentials, test the connection to verify that InfoCaptor can successfully communicate with your MySQL database. Once the connection is established, you can begin creating dashboards and visualizations based on your MySQL data, allowing you to gain valuable insights into your business operations.
Features What features does the Tableau-like Visualizer in InfoCaptor offer?
The Tableau-like Visualizer in InfoCaptor offers a user-friendly, drag-and-drop interface that allows users to create visualizations without needing SQL knowledge. This feature enables users to easily select dimensions and metrics from their data sources, choose from various chart types, and build comprehensive dashboards quickly. Unlike Tableau, InfoCaptor's Visualizer works directly with databases, allowing for seamless integration and real-time data analysis. Users can also utilize advanced visualization techniques similar to pivot tables, which provide sub-totals and grand totals, enhancing data interpretation. Additionally, the Visualizer supports multiple data sources, including SQL databases and simpler formats like CSV and Excel, making it versatile for different business needs. Overall, this feature empowers users to transform raw data into insightful visual representations efficiently.
Features How can I create and configure data tables in InfoCaptor?
To create and configure data tables in InfoCaptor, start by connecting to your desired data source, such as MySQL, Oracle, or PostgreSQL. You can also upload flat files like CSV or Excel directly into InfoCaptor's built-in mini data warehouse. Once connected, use the drag-and-drop interface to select dimensions and metrics for your table. If you need to combine data from multiple tables, you can write SQL queries to join them and then input the SQL into the data source configuration. After setting up your table, you can publish it directly to your WordPress site or create interactive dashboards that visualize your data effectively. This process allows you to build dynamic, live data tables tailored to your business needs without extensive coding knowledge.
Features What is the process for using the embedded Micro ETL feature in InfoCaptor?
The embedded Micro ETL feature in InfoCaptor allows users to efficiently extract, transform, and load data from various sources into their dashboards. To use this feature, first, access the InfoCaptor dashboard and navigate to the ETL section. Here, you can connect to your data sources, such as Google Analytics or Salesforce, by selecting the appropriate built-in connectors. Once connected, you can define the data extraction parameters, apply necessary transformations to clean or modify the data, and then load it into your InfoCaptor data warehouse. This streamlined process enables users to create dynamic visualizations and analytics without extensive coding, making it accessible for users of all skill levels. By leveraging the Micro ETL feature, businesses can ensure their dashboards are populated with up-to-date and relevant data, enhancing decision-making capabilities.
Features How do I utilize InfoCaptor to analyze customer purchasing trends?
To utilize InfoCaptor for analyzing customer purchasing trends, start by integrating it with your e-commerce platform, such as WooCommerce, to automatically pull in relevant sales data. Once connected, use InfoCaptor's dashboard features to create custom reports that visualize key metrics like sales volume, product performance, and customer behavior over time. You can set up filters to segment data by various parameters, such as demographics or purchase frequency, allowing for deeper insights. Additionally, leverage the analytics tools within InfoCaptor to identify patterns and trends, which can inform inventory management and marketing strategies. Regularly review these dashboards to stay updated on customer preferences and adjust your business strategies accordingly, ensuring data-driven decision-making that enhances overall performance.
ROI & pricing What measurable business value can InfoCaptor provide for my organization?
InfoCaptor provides measurable business value by transforming raw data into actionable insights through its comprehensive business intelligence capabilities, including dashboards, visualization, and analytics. By enabling organizations to aggregate data from diverse sources like SQL databases, CSV files, and Excel, InfoCaptor facilitates informed decision-making and enhances operational efficiency. The powerful data visualization tools help identify trends and patterns that might otherwise go unnoticed, allowing businesses to respond proactively to market changes. Additionally, InfoCaptor's commitment to customer support ensures that users can effectively leverage the software, maximizing their return on investment. Tailored solutions for specific industries further enhance its value, making it a versatile tool for organizations looking to optimize their data-driven strategies.
ROI & pricing How can I calculate the ROI of using InfoCaptor for business intelligence?
To calculate the ROI of using InfoCaptor for business intelligence, start by identifying the key metrics that reflect your business goals, such as increased revenue, reduced costs, or improved efficiency. Next, quantify the benefits gained from using InfoCaptor, such as time saved in data analysis, enhanced decision-making capabilities, and improved data visualization that leads to actionable insights. Assign a monetary value to these benefits, considering factors like increased sales or decreased operational expenses. Then, calculate the total costs associated with implementing InfoCaptor, including any training, maintenance, or subscription fees. Finally, use the formula ROI = (Net Benefits / Total Costs) x 100 to express your findings as a percentage. This approach will provide a clear picture of the financial impact of InfoCaptor on your business operations.
ROI & pricing What are the pricing plans available for InfoCaptor, and what do they include?
InfoCaptor offers two main pricing plans designed to cater to different user needs. The Cloud Starter Plan is priced at $29 per month and includes features such as support for Excel and CSV data, packaged data warehouse capabilities, Google Analytics integration, and unlimited dashboards, though it limits the number of connections. The more comprehensive Cloud Business Plan is available for $39 per month, providing all features of the Starter Plan along with support for all SQL databases, unlimited dashboards, and options for PDF and image exports. Both plans allow users to share live dashboards via URL, making InfoCaptor a flexible choice for businesses looking to leverage business intelligence tools effectively.
ROI & pricing What is the total cost of ownership for implementing InfoCaptor in my business?
The total cost of ownership (TCO) for implementing InfoCaptor in your business includes several factors beyond just the subscription fees. InfoCaptor offers two primary pricing plans: the Cloud Starter Plan at $29 per month and the Cloud Business Plan at $39 per month, which provide unlimited dashboards and various data integration options, including Google Analytics and Salesforce. Additionally, consider potential costs for consulting services if you require assistance in building dashboard prototypes or training your team, which can enhance the implementation process. It's also important to factor in any costs associated with data storage and management, as well as the time invested in training staff to effectively use the platform. Overall, InfoCaptor is positioned as a cost-effective solution compared to other BI tools, making it suitable for small to medium-sized businesses looking to leverage data analytics without incurring excessive expenses.
ROI & pricing How quickly can I expect to see value from using InfoCaptor after implementation?
After implementing InfoCaptor, users can expect to see value relatively quickly, often within a few days to a couple of weeks, depending on the complexity of their data and specific use cases. The platform is designed for ease of use, with a programmer interface similar to Microsoft’s Power BI, which allows users to create dashboards and visualizations without extensive coding or multiple JavaScript files. This user-friendly approach enables organizations to start charting their MySQL data and generating insights almost immediately. Additionally, InfoCaptor's strong customer support can assist with any setup challenges, further accelerating the time to value. Overall, businesses can leverage InfoCaptor's capabilities to enhance their data visualization and analytics efforts swiftly, leading to informed decision-making and improved operational efficiency.
ROI & pricing What cost savings can I anticipate by using InfoCaptor for data visualization and reporting?
By using InfoCaptor for data visualization and reporting, you can anticipate significant cost savings compared to other business intelligence solutions. InfoCaptor offers a competitive pricing model, with plans starting at just $29 per month, which is considerably lower than alternatives like QlikView or Xcelsius, where implementation costs can exceed $10,000. This affordability allows small to medium-sized businesses to access powerful dashboard capabilities without breaking the bank. Additionally, InfoCaptor's versatile connectivity to various data sources, including SQL databases and Excel files, reduces the need for extensive coding or additional software, further lowering operational costs. Many users have reported that the ease of use and the availability of consulting services for dashboard training enhance productivity, leading to faster decision-making and ultimately contributing to overall cost efficiency in data management and reporting.
Capabilities Can InfoCaptor automate data analytics for large datasets?
Yes, InfoCaptor can automate data analytics for large datasets, making it a powerful tool for businesses that require efficient data processing and visualization. With its comprehensive BI application, InfoCaptor integrates seamlessly with various data sources, including Salesforce, allowing users to centralize their analytics data in a MySQL database. This enables the creation of automated dashboards that can visualize complex datasets without the need for extensive coding or SQL knowledge. The intuitive drag-and-drop interface simplifies the process of generating charts and graphs, making it accessible for users at all skill levels. By automating data analytics, InfoCaptor helps organizations save time, enhance decision-making, and derive actionable insights from their large datasets.
Capabilities Does InfoCaptor support advanced data visualization techniques?
Yes, InfoCaptor supports advanced data visualization techniques, making it a robust choice for businesses seeking to analyze and present their data effectively. The platform offers a comprehensive suite of features, including a Dashboard Editor and Visual Analyzer, which allow users to create dynamic charts and graphs without requiring extensive coding knowledge. Users can leverage SQL queries for custom analysis or utilize the intuitive drag-and-drop interface to visualize data effortlessly. This flexibility enables organizations to derive meaningful insights from complex datasets, similar to what is offered by other BI tools like Tableau. Additionally, InfoCaptor's ability to connect directly to various data sources enhances its capability to deliver advanced visualizations tailored to specific business needs.
Capabilities Can InfoCaptor handle real-time analytics for business intelligence?
Yes, InfoCaptor can handle real-time analytics for business intelligence, making it a robust choice for organizations that require timely insights. The platform is designed to provide dynamic dashboards that can visualize data as it updates, allowing users to monitor key performance indicators and other critical metrics in real time. This capability is essential for businesses that need to make quick, informed decisions based on the latest data trends. Additionally, InfoCaptor's integration with various data sources ensures that users can pull in real-time data seamlessly, enhancing the overall effectiveness of their analytics efforts. By leveraging InfoCaptor for real-time analytics, businesses can improve operational efficiency and responsiveness to market changes.
Capabilities Does InfoCaptor provide enterprise-level security and compliance features?
Yes, InfoCaptor provides enterprise-level security and compliance features designed to meet the needs of organizations handling sensitive data. The platform includes robust security measures such as user authentication, role-based access control, and data encryption to ensure that only authorized personnel can access critical information. Additionally, InfoCaptor supports compliance with various industry standards, which is essential for businesses in regulated sectors like healthcare and finance. This commitment to security not only protects data integrity but also helps organizations maintain compliance with regulations, thereby reducing the risk of data breaches and associated penalties. Overall, InfoCaptor's security features make it a suitable choice for enterprises looking to safeguard their data while leveraging powerful business intelligence capabilities.
Capabilities Can InfoCaptor integrate with various data types and workflows across teams?
Yes, InfoCaptor can integrate with various data types and workflows across teams, making it a versatile tool for businesses. It connects seamlessly to multiple databases, including MySQL, PostgreSQL, and Oracle, allowing users to pull data from diverse sources. This capability enables teams to collaborate effectively by accessing and visualizing data in real-time, regardless of their departmental focus. Additionally, InfoCaptor's customizable dashboards and analytics features can be tailored to meet specific industry requirements, facilitating cross-functional insights and decision-making. By providing a unified platform for data visualization and analysis, InfoCaptor enhances workflow efficiency and empowers teams to make data-driven decisions collaboratively.
Capabilities Does InfoCaptor offer customizable reporting options for specific industries?
Yes, InfoCaptor offers customizable reporting options tailored to specific industries, making it a versatile business intelligence tool. It is designed to meet unique requirements across various sectors, including healthcare, where it provides OEM solutions that cater to industry-specific needs. This customization allows businesses to create reports that reflect their operational metrics and KPIs, enhancing data-driven decision-making. For instance, e-commerce businesses using platforms like Shopify can benefit from upcoming features that align with their reporting needs. By leveraging InfoCaptor's customizable reporting capabilities, organizations can gain deeper insights into their performance, optimize strategies, and ultimately drive growth based on solid data analytics.
Use cases How can SDRs use InfoCaptor to improve their sales analytics and reporting?
Sales Development Representatives (SDRs) can leverage InfoCaptor to enhance their sales analytics and reporting by utilizing its comprehensive dashboard and visualization capabilities. By integrating InfoCaptor with their existing CRM systems, such as Salesforce, SDRs can centralize their sales data into a MySQL database, allowing for streamlined reporting and analysis. This integration enables SDRs to create dynamic visualizations that track key performance indicators, such as lead conversion rates and sales pipeline metrics, without the need for extensive coding. Additionally, InfoCaptor's user-friendly interface simplifies the process of generating automated reports, helping SDRs quickly identify trends and make data-driven decisions to optimize their sales strategies. Overall, InfoCaptor empowers SDRs to gain deeper insights into their sales processes, ultimately driving better performance and results.
Use cases What are the best use cases for marketers utilizing InfoCaptor for digital marketing dashboards?
Marketers can leverage InfoCaptor for digital marketing dashboards in several impactful ways. One of the primary use cases is to visualize campaign performance metrics, allowing marketers to track key performance indicators (KPIs) such as conversion rates, click-through rates, and return on investment in real-time. Additionally, InfoCaptor's ability to integrate with platforms like Google Analytics and Salesforce enables marketers to consolidate data from various sources, providing a comprehensive view of customer interactions and behaviors. This facilitates data-driven decision-making and helps in identifying trends and opportunities for optimization. Furthermore, the drag-and-drop interface simplifies the creation of dynamic charts and reports, making it accessible for marketers without extensive coding knowledge, thus enhancing their ability to communicate insights effectively to stakeholders.
Use cases In what scenarios should RevOps teams implement InfoCaptor for predictive analytics?
RevOps teams should implement InfoCaptor for predictive analytics in scenarios where they need to enhance decision-making through data-driven insights. For instance, when analyzing customer behavior trends, InfoCaptor's powerful data visualization capabilities can help identify patterns that inform sales strategies and marketing campaigns. Additionally, teams can leverage its analytics features to forecast revenue, optimize resource allocation, and improve operational efficiency by integrating data from various sources like Salesforce or other CRM systems. InfoCaptor also supports real-time monitoring of key performance indicators, enabling teams to adjust strategies proactively based on predictive insights. By utilizing InfoCaptor, RevOps teams can transform complex data into actionable intelligence, ultimately driving better business outcomes.
Use cases How can sales leaders leverage InfoCaptor to create executive dashboards for performance tracking?
Sales leaders can leverage InfoCaptor to create executive dashboards for performance tracking by utilizing its comprehensive Business Intelligence features, which include data visualization, analytics, and a user-friendly interface. To get started, they can connect various data sources such as SQL databases, Excel spreadsheets, or even CRM systems like Salesforce to consolidate key performance indicators (KPIs) in real-time. By using InfoCaptor's drag-and-drop functionality, sales leaders can easily design custom dashboards that display critical metrics, trends, and comparisons against sales goals. This allows for proactive decision-making and quick identification of underperforming areas. Additionally, the ability to create mockups without extensive coding makes it accessible for users with varying technical skills, ensuring that sales leaders can effectively communicate performance insights to their teams and stakeholders.
Use cases What specific workflows in healthcare analytics can benefit from using InfoCaptor?
InfoCaptor offers a range of workflows in healthcare analytics that can significantly enhance operational efficiency and decision-making. Specifically, it supports OEM dashboard reporting tailored to the unique needs of healthcare providers, enabling the integration of Electronic Health Records (EHR) systems like Qualifacts, Netsmart, and Best Notes into comprehensive analytics solutions. This integration allows for the creation of dashboards that track outcomes, quality, productivity, and compliance, which are crucial for behavioral health providers and other healthcare organizations. Additionally, InfoCaptor aids in organizing complex data narratives, facilitating grant writing, and providing insights for long-term policy analysis. By leveraging these capabilities, healthcare organizations can make data-driven decisions, improve patient care, and streamline their operations effectively.
Use cases How can teams effectively adopt InfoCaptor for visualizing MySQL data without extensive coding?
Teams can effectively adopt InfoCaptor for visualizing MySQL data without extensive coding by leveraging its intuitive drag-and-drop interface, which simplifies the process of creating dynamic charts and dashboards. Users can start by connecting InfoCaptor directly to their MySQL database, allowing them to access and visualize data without needing to write complex SQL queries. The platform offers a visual analyzer and dashboard editor that resemble tools like Microsoft Power BI, making it user-friendly for those with minimal technical expertise. Additionally, teams can utilize pre-built templates and recipes within InfoCaptor to quickly generate visualizations, ensuring that even non-technical users can create insightful reports and dashboards efficiently. This approach not only streamlines the data visualization process but also enhances collaboration across teams by providing easy access to shared insights.
Alternatives What are the best alternatives to InfoCaptor for data visualization?
When considering alternatives to InfoCaptor for data visualization, several notable options stand out. Tableau is a leading choice, known for its robust capabilities in creating interactive and shareable dashboards, though it may require more technical expertise. Microsoft Power BI is another strong contender, offering seamless integration with other Microsoft products and a user-friendly interface, making it accessible for non-technical users. Google Data Studio provides a free option with solid visualization features, ideal for those already using Google’s ecosystem. Additionally, Qlik Sense offers powerful associative data modeling and analytics capabilities, catering to businesses that need in-depth insights. Each of these tools has its strengths, so the best choice will depend on your specific needs, budget, and existing technology stack.
Alternatives How does InfoCaptor compare to IBM Cognos Analytics?
InfoCaptor and IBM Cognos Analytics are both powerful business intelligence tools, but they cater to different user needs and preferences. InfoCaptor is known for its user-friendly interface and flexibility in creating custom dashboards and visualizations, making it suitable for organizations that prioritize ease of use and quick deployment. In contrast, IBM Cognos Analytics offers a more comprehensive suite of features, including advanced analytics and reporting capabilities, which may appeal to larger enterprises requiring in-depth data analysis and integration with other IBM products. While InfoCaptor excels in dashboard customization and real-time data visualization, IBM Cognos is better suited for complex reporting and enterprise-level analytics. Ultimately, the choice between the two depends on the specific requirements of the business, such as the need for advanced analytics versus user-friendly dashboard creation.
Alternatives What are the key differences between InfoCaptor and Dundas BI?
InfoCaptor and Dundas BI are both robust business intelligence tools, but they cater to different user needs and preferences. InfoCaptor is known for its user-friendly interface that allows for easy drag-and-drop dashboard creation, making it suitable for users who may not have extensive technical skills. It also features built-in connectors for platforms like Google Analytics and Salesforce, along with a micro ETL and data warehouse capabilities. In contrast, Dundas BI offers more advanced data visualization options and customization features, appealing to users who require deeper analytical capabilities and flexibility in their reporting. While InfoCaptor focuses on simplicity and ease of use, Dundas BI emphasizes powerful analytics and extensive customization, making the choice between them dependent on the specific needs of the organization.
Alternatives Is Yellowfin BI a better choice than InfoCaptor for business intelligence?
When comparing Yellowfin BI and InfoCaptor for business intelligence, both tools offer unique advantages that cater to different business needs. Yellowfin BI is known for its strong collaborative features and user-friendly interface, making it ideal for teams that prioritize sharing insights and working together on data analysis. On the other hand, InfoCaptor provides a comprehensive suite that includes dashboards, visualization, and analytics, all at a competitive price point, including a free version, which can be particularly appealing for budget-conscious organizations. Ultimately, the choice between Yellowfin BI and InfoCaptor depends on your specific requirements, such as collaboration needs, budget constraints, and the complexity of data analysis you intend to perform.
Alternatives What makes Birst a stronger option compared to InfoCaptor?
Birst and InfoCaptor both offer robust business intelligence solutions, but Birst may be considered a stronger option for organizations seeking advanced analytics capabilities and a more integrated approach to data management. Birst excels in its ability to provide a unified data model, which allows for seamless data integration across various sources, enhancing data consistency and accuracy. Additionally, Birst's cloud-based architecture supports scalability and flexibility, making it suitable for larger enterprises with complex data needs. Its advanced analytics features, including predictive analytics and machine learning capabilities, empower users to derive deeper insights from their data. In contrast, InfoCaptor focuses on powerful data visualization and customizable dashboards, which may appeal to businesses prioritizing visual data representation. Ultimately, the choice between Birst and InfoCaptor depends on specific business requirements and the desired level of analytical sophistication.
Alternatives How does InfoCaptor stack up against Tableau in terms of features?
InfoCaptor and Tableau are both powerful business intelligence tools, but they cater to different user needs and preferences. InfoCaptor offers a comprehensive suite that includes dashboards, visualization, analytics, and a built-in data warehouse, allowing users to create custom reports and dashboards with ease, even without extensive SQL knowledge. Its drag-and-drop interface simplifies the analysis process, making it accessible for users at all skill levels. In contrast, Tableau is renowned for its advanced visualization capabilities and extensive data connectivity options, making it ideal for users who require sophisticated data analysis and presentation. While InfoCaptor is often seen as a more affordable option with a free offering, Tableau may be preferred for its robust features and community support. Ultimately, the choice between the two depends on specific business needs, budget, and user expertise.
InfoCaptor Competitors


InfoCaptor Features
- Low
- Medium
- High
| FEATURE | RATINGS AND REVIEWS |
|---|---|
| Analytics | Read Reviews (41) |
| Custom Reports | Read Reviews (192) |
| CAPABILITIES | RATINGS AND REVIEWS |
|---|---|
| Analytics | Read Reviews (41) |
| Custom Reports | Read Reviews (192) |
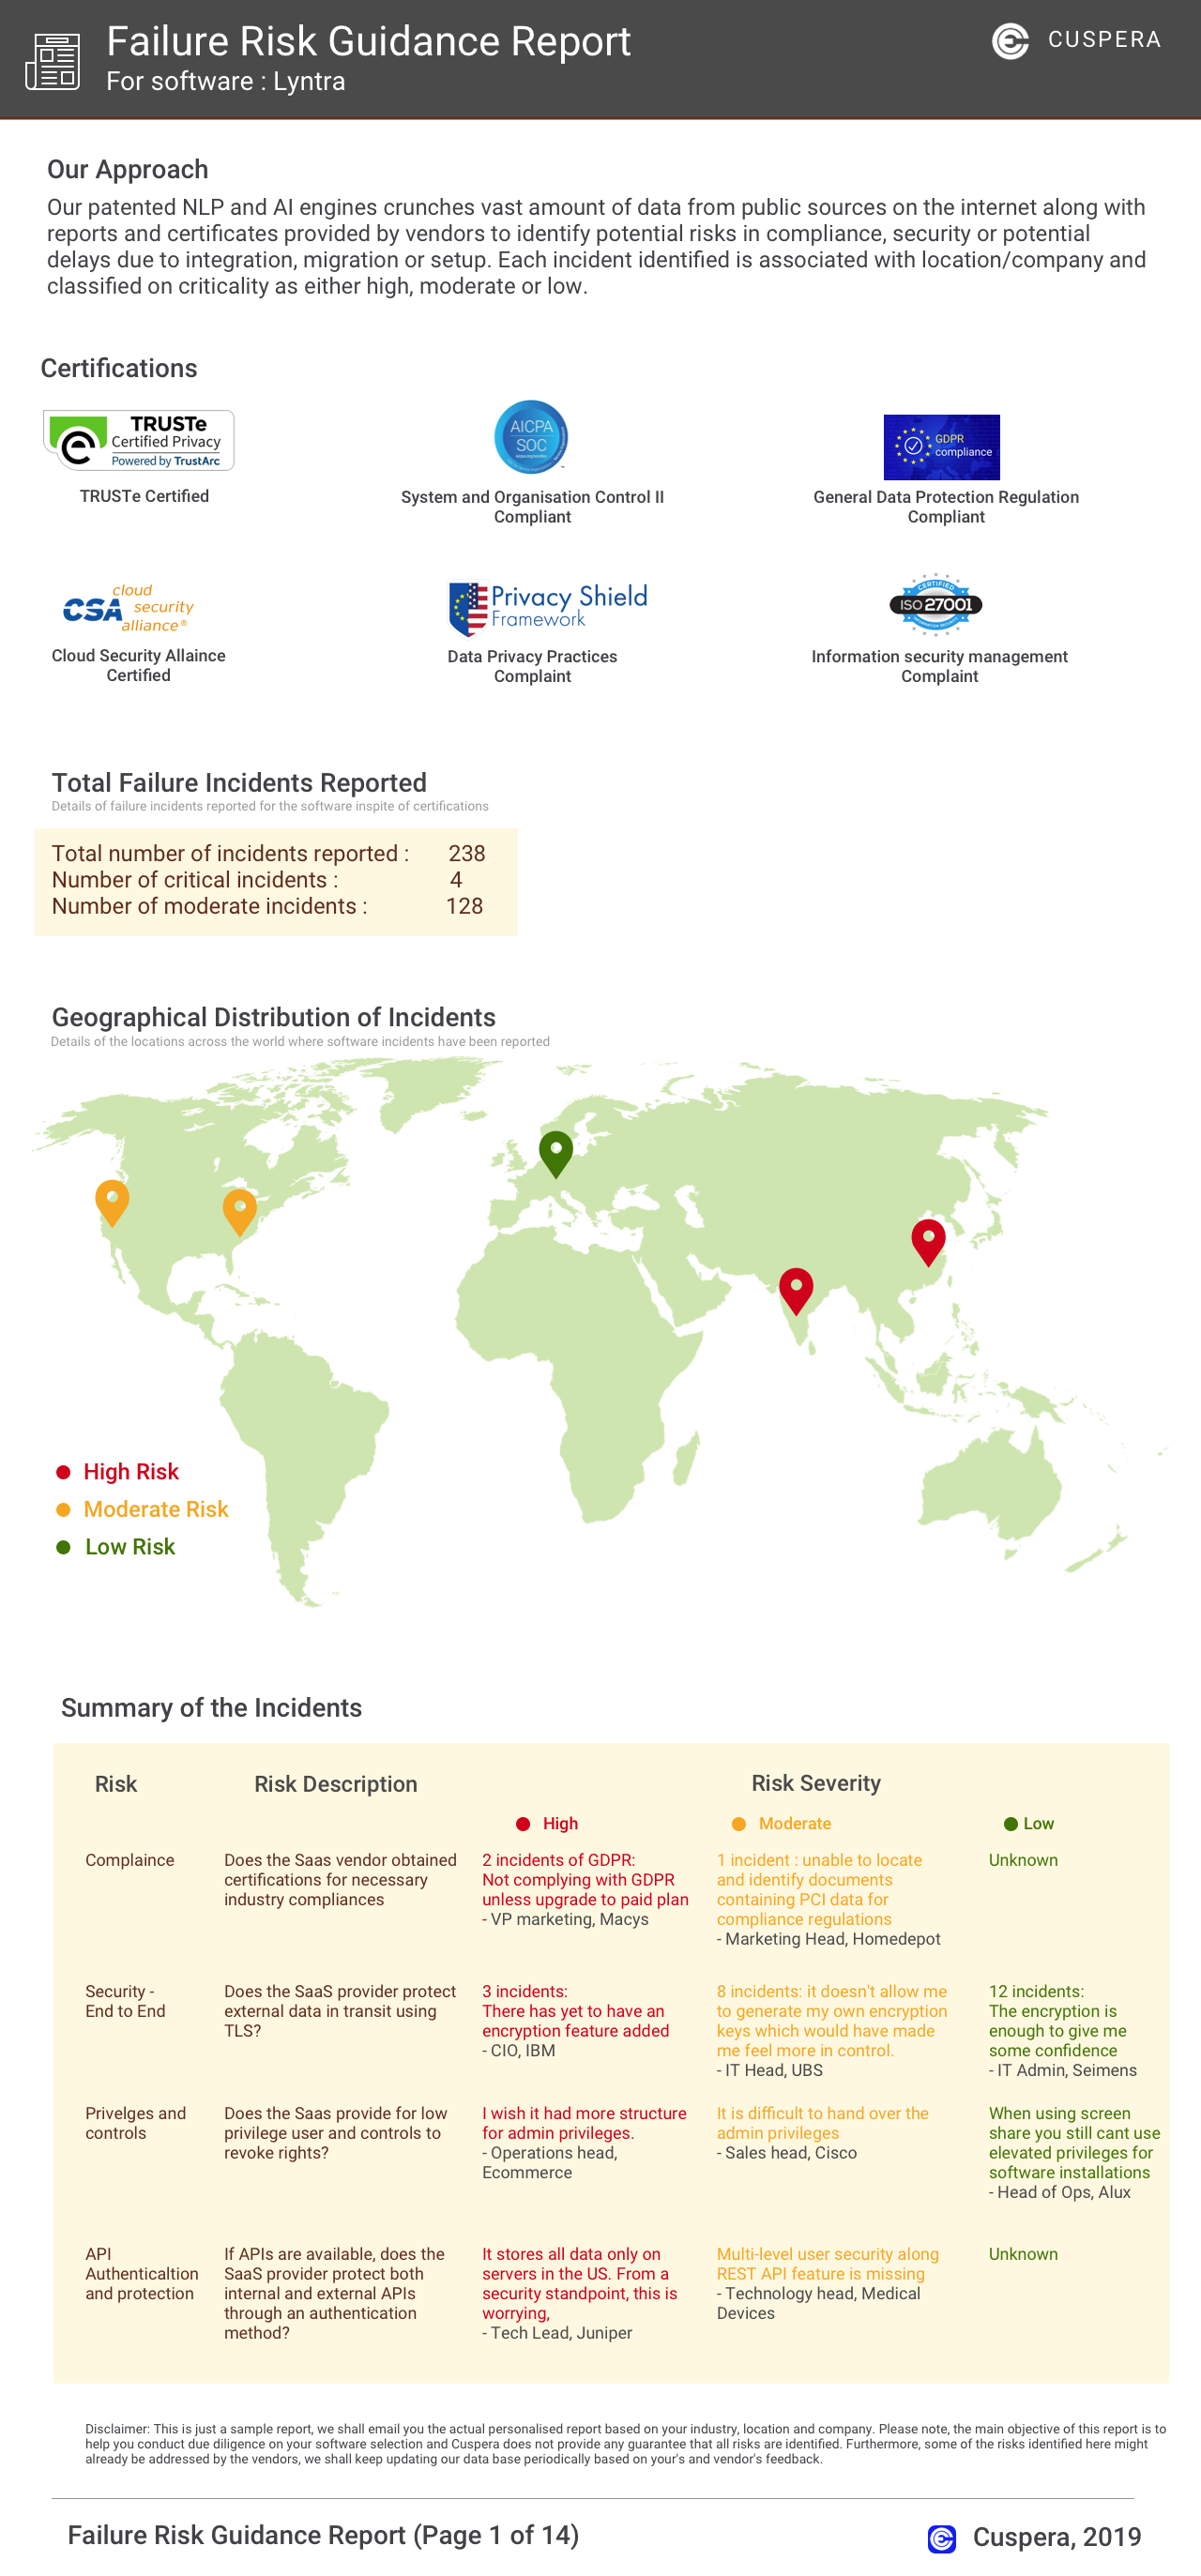
Software Failure Risk Guidance
?for InfoCaptor
Overall Risk Meter
Top Failure Risks for InfoCaptor
InfoCaptor News
InfoCaptor AI: Building a Visual Second Brain for the YouTube Generation - TechBullion
InfoCaptor AI introduces a Chrome extension that transforms YouTube videos into a personal knowledge hub. It offers automatic transcripts, summaries, entity extraction, word clouds, and knowledge graphs. This tool aids researchers, students, entrepreneurs, and professionals by enhancing content retention and recall. InfoCaptor AI is part of a productivity ecosystem with Vizbull and Wireframes.org, providing integrated solutions for learning, creativity, and design.
InfoCaptor Profile
Company Name
InfoCaptor
Company Website
https://www.infocaptor.com/HQ Location
Pittsburgh,PA
Employees
1-10
Social


Financials
PRIVATE

What makes InfoCaptor ideal for Social Media Analytics?