Comparison Summary
This comparison report of Databox vs. Visual UGC powered by Stackla is based on a specific set of business needs and context. The comparison uses 7734 Cuspera insights based on peer reviews, case studies, testimonials, and expert opinions across 50+ sources.
Introducing Databox and Visual UGC powered by Stackla
Databox, Google Data Studio, Cyfe Business Dashboard, etc., belong to a category of solutions that help Business Intelligence, whereas Visual UGC powered by Stackla, AspireIQ, Klear Influencer Marketing, etc., belong to a category of solutions that help Influencer Marketing. Different products excel in different areas, so the best platform for your business will depend on your specific needs and requirements.
Databox covers Social Media Management with Social Media, Advertisement with Social Media, Engagement Management with Website, Content Management, etc.
Visual UGC powered by Stackla focuses on Content Management with Social Media, Engagement Management with User Generated Content, Communication Management with Social Media, Social Media Management with Social Media, etc.
"We’re not just throwing deliverables over the fence, we’re saying ‘here’s what you need to better understand your audience. Here’s what you need to reach your goals. " - Paul Schmidt
"It was great to see and showcase those stories, especially because there was such care given by the filmmakers to show all sides of the war and the various voices from the U.S. and Vietnam.”Eric Freeland, Senior Director of Digital Programing " - PBS
Unsure which of these solutions is right for you? Our Cuspera AI engine can compare them based on your needs and specific to your industry and context. Get your personalized report today.

 Visual UGC powered by Stackla
Focus area
Visual UGC powered by Stackla is better than Databox for
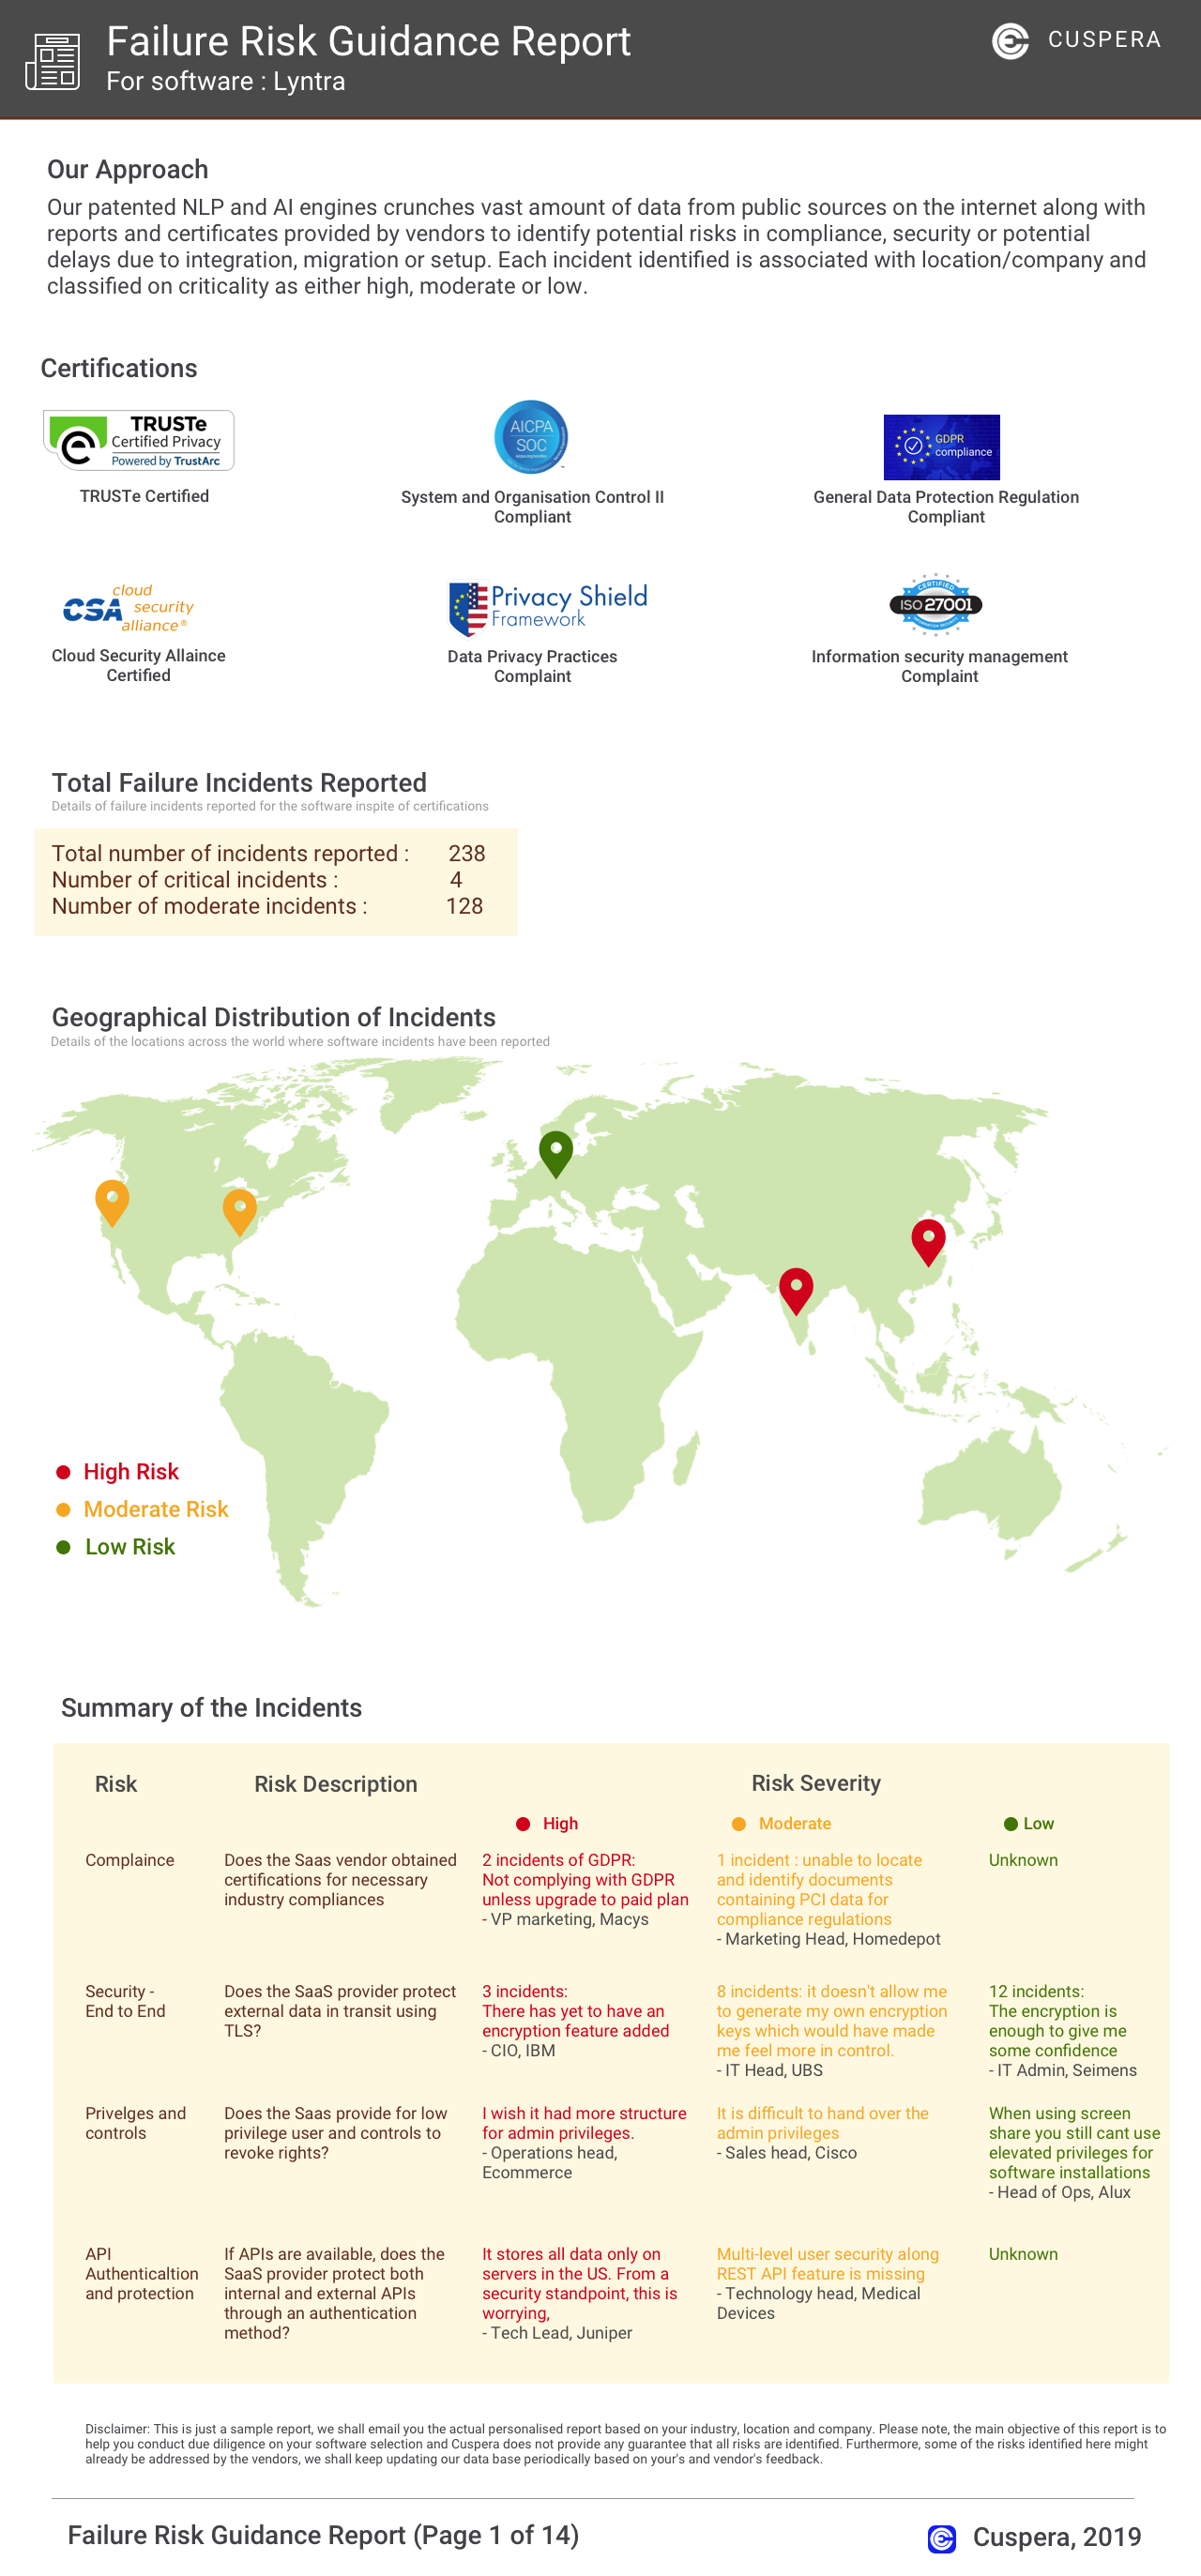
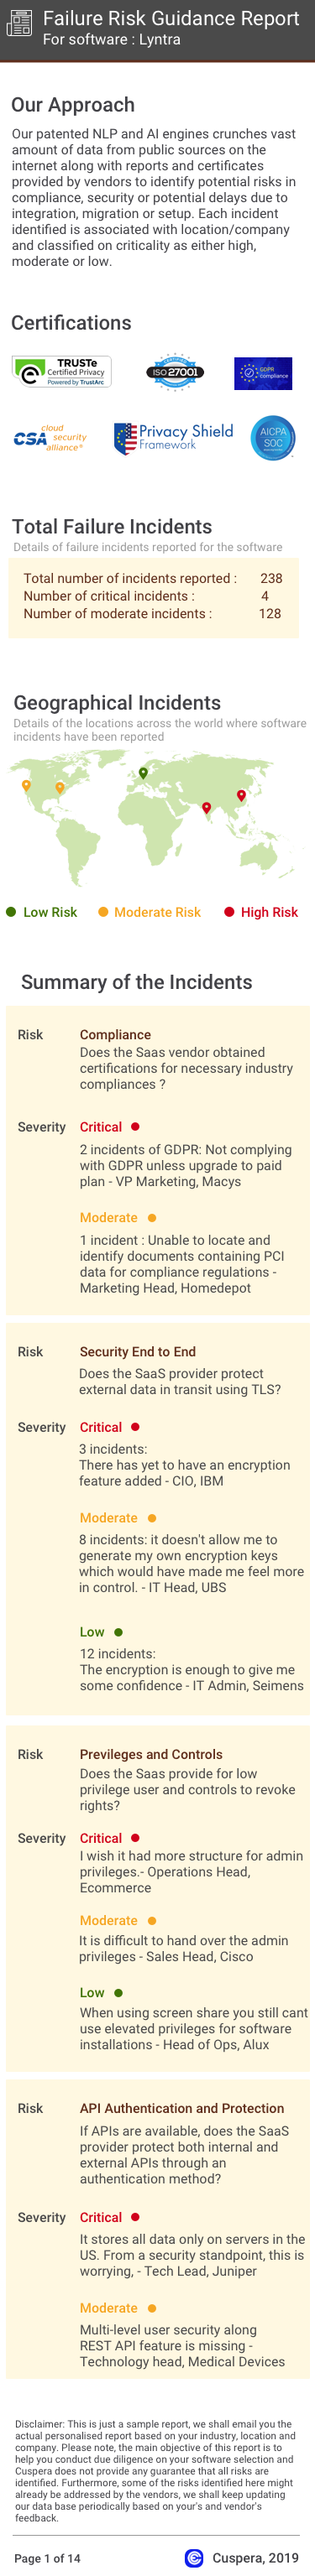
Software Failure Risk
About
Databox: #1 Business Analytics Platform & KPI Dashboards
Stackla |Discover, manage and display the most engaging visual content across all your marketing touchpoints
Financials
SEED
SERIES B
Business Need
Total Processes
(we found evidences for)
96
69
Total Goals
(we found evidences for)
16
15
Top Processes
Evidences indicate better relative satisfaction
Top Goals
Goals Achieved
-
Acquire customers
-
Improve ROI
-
Increase sales & revenue
-
Enhance customer relationships
-
Improve efficiency
-
Grow market share
-
Improve internal communications
-
Improve digital and social presence
-
Launch new products
-
Build brand awareness
-
Reduce bounce
-
Improve visibility
-
Establish thought leadership
-
Enter new markets internationally or locally
-
Scale best practices
-
Increase customer life time value
- See 13 more
-
Improve digital and social presence
-
Enhance customer relationships
-
Acquire customers
-
Build brand awareness
-
Improve brand engagement
-
Increase sales & revenue
-
Improve ROI
-
Improve efficiency
-
Improve internal communications
-
Scale best practices
-
Enter new markets internationally or locally
-
Grow market share
-
Launch new products
-
Reduce bounce
-
Improve stakeholder relations
- See 12 more
Top Channels
Channels Used
-
social media
-
user generated content
-
website
-
e-mail
-
mobile
-
offline
-
Facebook
-
Instagram
-
mobile app
-
chat
-
video
-
Slack
-
promotions
-
mass media
-
blogs
-
on premises
-
causes and charity
-
Facebook page
-
Twitter
-
trade shows
-
games
-
phone calls
-
newsletter
-
point of sale
-
print media
-
magazine
-
LinkedIn
-
television
-
omnichannel
-
coupons
- See 27 more
-
social media
-
user generated content
-
website
-
e-mail
-
mobile
-
offline
-
Facebook
-
Instagram
-
mobile app
-
chat
-
video
-
Slack
-
promotions
-
mass media
-
blogs
-
on premises
-
causes and charity
-
Facebook page
-
Twitter
-
trade shows
-
games
-
phone calls
-
newsletter
-
point of sale
-
print media
-
magazine
-
LinkedIn
-
television
-
omnichannel
-
coupons
- See 27 more
Failure Risk Guidance Security Report?
Compliance Risk
{{{rsh_C_1}}}
{{{rsh_C_1}}}
Security & Privacy Risk
{{{rsh_C_1}}}
{{{rsh_C_1}}}
Integration Risk
{{{rsh_C_1}}}
{{{rsh_C_1}}}
Migration Risk
{{{rsh_C_1}}}
{{{rsh_C_1}}}
IT and Other Capabilities
- Low
- Medium
- High