
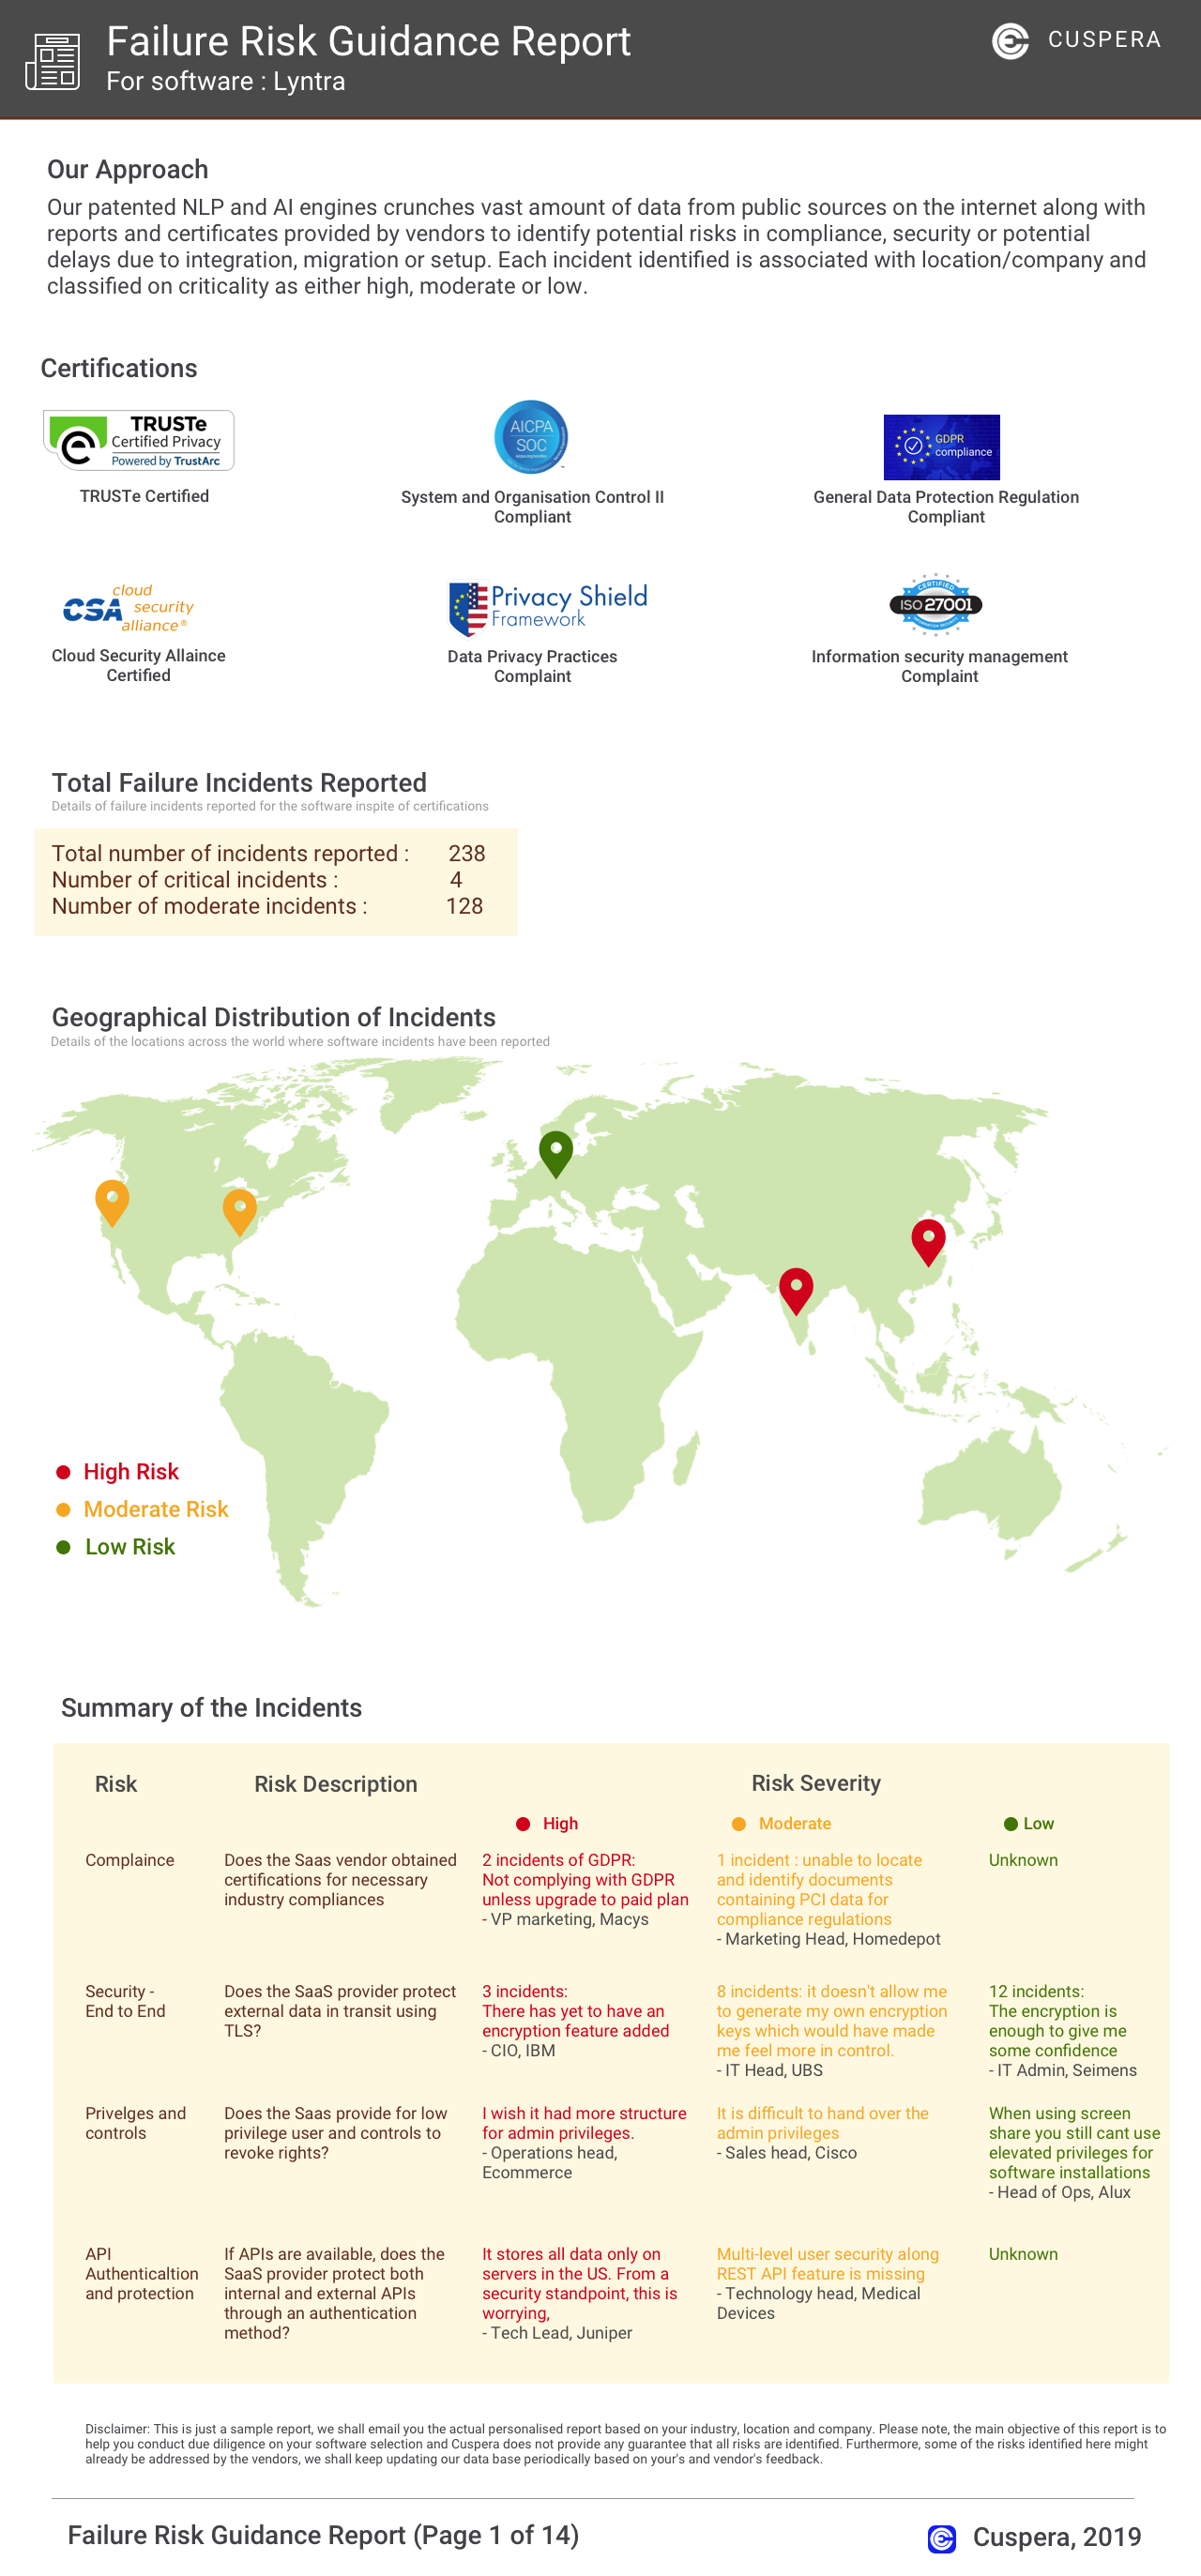
Cloudera Data Visualization Overview
Discover comprehensive insights into Cloudera Data Visualization. Learn more about product features, capabilities and expert reviews based on 171 insights and explore use-cases showcasing how Cloudera Data Visualization enhances Funnel analysis and drives growth.
This is a summary of the comprehensive capabilities and benefits of Cloudera Data Visualization based on over 171 insights from peer reviews, customer testimonials, and expert opinions. We included citations from these sources so you can read the full content at the original source if you wish.
Do you need to check if Cloudera Data Visualization is right for your needs? Our Cuspera AI engine can evaluate how Cloudera Data Visualization fits your specific business needs, industry, and context. Get your personalized assessment report today.
Cloudera Data Visualization supports business activities such as:
- Funnel Analysis
- Competitive Intelligence
- White Labeling
- Engaging And Following Up
Cloudera Data Visualization can help you with many business goals, such as Acquire Customers. As a solution, Cloudera Data Visualization's capabilities include Dashboard.
Cloudera Data Visualization was founded in 2008. Financial Services Vertical is its biggest customer base.
Reviews
"...business is able to understand and answer more indepth questions on content consumption, engagement, etc...." Peer review by Internal Consultant
Cloudera Data Visualization Reviews
11 buyers and buying teams have used Cuspera to assess how well Cloudera Data Visualization solved their business needs. Cuspera uses 171 insights from these buyers along with peer reviews, customer case studies, testimonials, expert blogs and vendor provided installation data to help you assess the fit for your specific business needs.
Business Priorities
Acquire Customers is the most popular business priority peers achieved using Cloudera Data Visualization.
Use Cases
Peers recommend Funnel Analysis , Competitive Intelligence , White Labeling , as the business use cases that they have been most satisfied while using Cloudera Data Visualization.
Read Peer Reviews and Expert Experience for Business Use Cases
| BUSINESS USE CASES | RATINGS | CUSTOMER AND EXPERT EXPERIENCES |
|---|---|---|
| Funnel Analysis |
4.55/5 ★ |
"...Arcadia Data provides the first visual analytics and BI platform native to big data that delivers the scale, performance, and agility business users need to discover and productionize real-time insights...." Peer review from Arcadia Data |
| Competitive Intelligence |
4.06/5 ★ |
"...A recent benchmark report on Arcadia Enterprise shows BI dashboard acceleration of up to 88x. ..." Hadoop Data Visualization |
| White Labeling |
3.56/5 ★ |
"...With CSS and JavaScript, you can white label the interface for a seamless look and feel and modify visuals to meet specific analytic requirements. ..." Hadoop Data Visualization |
| PEER EXPERIENCES | |
|---|---|
| Funnel Analysis |
4.55/5 ★ |
"...Arcadia Data provides the first visual analytics and BI platform native to big data that delivers the scale, performance, and agility business users need to discover and productionize real-time insights...." Peer review from Arcadia Data |
|
| Competitive Intelligence |
4.06/5 ★ |
"...A recent benchmark report on Arcadia Enterprise shows BI dashboard acceleration of up to 88x. ..." Hadoop Data Visualization |
|
| White Labeling |
3.56/5 ★ |
"...With CSS and JavaScript, you can white label the interface for a seamless look and feel and modify visuals to meet specific analytic requirements. ..." Hadoop Data Visualization |
|
1+ more Business Use Cases
Our AI advisor, Wyz, harnessed 171 insights from peers and experts to help you assess how these Cloudera Data Visualization use cases fit your business needs.


Popular Business Setting
for Cloudera Data Visualization
Top Industries
- Financial Services
- Real Estate
- Telecommunications
Popular in
- Large Enterprise
- Mid Market
- Enterprise

Peers used Cloudera Data Visualization to Acquire customers
Peer and Expert Opinion on Features
for Cloudera Data Visualization
- Low
- Medium
- High
| FEATURES | RATINGS AND REVIEWS |
|---|---|
| Dashboard | Read Reviews (10) |
| FEATURES | RATINGS AND REVIEWS |
|---|---|
| Dashboard | Read Reviews (10) |
IT and Other Capabilities
for Cloudera Data Visualization
- Low
- Medium
- High
| CAPABILITIES (DATA) | RATINGS AND REVIEWS |
|---|---|
| Data Import | Read Reviews (13) |
| Data Export | Read Reviews (13) |
| CAPABILITIES (DATA) | RATINGS AND REVIEWS |
|---|---|
| Data Import | Read Reviews (13) |
| Data Export | Read Reviews (13) |
| CAPABILITIES (SUPPORT) | RATINGS AND REVIEWS |
|---|---|
| 24/7 Support | Read Reviews (8) |
| CAPABILITIES (SUPPORT) | RATINGS AND REVIEWS |
|---|---|
| 24/7 Support | Read Reviews (8) |
| CAPABILITIES (OTHER) | RATINGS AND REVIEWS |
|---|---|
| AI Powered | Read Reviews (3) |
| Analytics | Read Reviews (38) |
| Custom Reports | Read Reviews (70) |
| CAPABILITIES (OTHER) | RATINGS AND REVIEWS |
|---|---|
| AI Powered | Read Reviews (3) |
| Analytics | Read Reviews (38) |
| Custom Reports | Read Reviews (70) |
Software Failure Risk Guidance
?for Cloudera Data Visualization
Top Failure Risks for Cloudera Data Visualization
Vendor Profile Details
HQ Location
395 Page Mill Rd, Palo Alto, CA 94306
Employees
1001-5000
Social
Financials
IPO

Get a personalised risk report for Cloudera Data Visualization
See Sample Risk ReportTell us more about yourself so that we can personalise incidents for your location, industry etc.
Connect to vendor request
Cloudera Data Visualization may get in touch with you regarding your request.
Request Custom Quote
Cloudera, Inc. will get in touch with you regarding your request.